Where do renewables stand in Australia?
As debates over the Renewable Energy Target and carbon pricing raged on, renewable sources quietly had a record breaking year in 2012, responsible for 13.14 per cent of Australia’s electricity generation, up from 9.64 per cent.
The dominant source remains hydro (with 58% of renewables), but wind (26%) and solar (8%) are increasing their share, according to the Clean Energy Australia 2012 Report, prepared by the Clean Energy Council.

While renewables made a greater impact, it was far from a record year in terms of investment as new wind planning laws and a ‘wait-and-see’ approach to the RET Review helped stymie confidence.
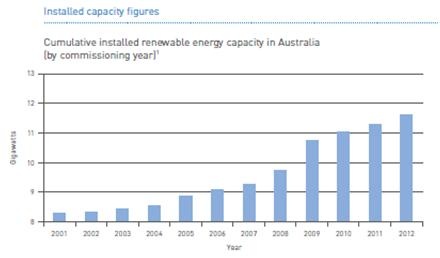
Regardless, more than $4.2 billion (down from $5.5 billion) was invested in renewable energy and energy smart technologies in 2012, with 14 large-scale projects coming online. The capacity of the projects, 380 megawatts, was well down on 2011 when 556 MW became operational – and a long way from the record new capacity of over 1 GW back in 2009.
That record will likely stand through this year as large-scale projects due to come online this year – which will include the already operational 420 MW Macarthur wind farm – amount to 735 MW across eight projects. This is broken down into 683 MW of new wind, 44 MW of solar thermal, 6 MW of hydro, 1.1 MW of landfill gas and 1 MW of wave power.
Beyond this there are a further seven wind farms under construction due for completion in 2014/15, adding a further 944 MW of capacity.

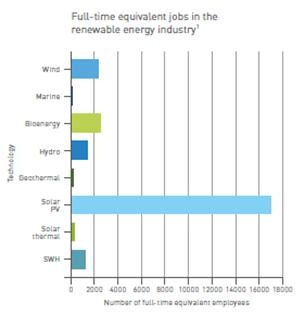
Given the strong development over the past decade, the sector is now home to over 24,000 full-time jobs, with solar PV dominating due to the rapid recent development of the residential PV market.

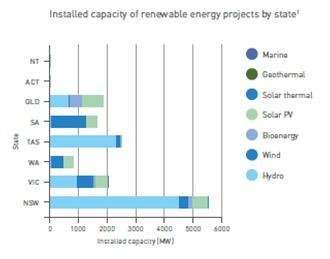
The data in the report provide an in-depth overview of the current position of renewables in the country, with the differences on a state-by-state basis very noticeable (see graph below).
New South Wales and Tasmania are major hydro players. Queensland is home to the most solar PV. South Australia’s renewables capacity is dominated by wind, while Western Australia has a fairly even split of solar PV and wind and Victoria is fairly diverse in having significant contributions from PV, hydro and wind.


