The US economy gets healthier


Summary: In the US, jobs growth is very strong, although wage growth is low and underemployment rates remain high. The private sector is growing well above average, although growth in industrial production has slumped. Some leading indicators, which try to forecast where the economy is heading, are positive. |
Key take-out: There are still some legacy issues, but most statistics show the US economy is quite healthy and getting healthier. |
Key beneficiaries: General investors. Category: Economy. |
With the increased engagement by Australian investors in directly held US listed shares, ETFs and funds there is now a real need for Eureka Report subscribers to be familiar with key aspects of the US economy. There is also a growing audience building a share portfolio under guidance from my colleague Clay Carter.
Rightly our subscribers are cautious on any data flow being presented, and that is wise. Statistics as we know are prone to errors, outright manipulation and the biases of those compiling them. Those produced by China and also the Australian Bureau of Statistics come to mind here.
The US is a little different. The data sources are diverse, unlike say in Australia and China, there are many data providers in the US and so these biases and errors are much less prevalent. That doesn't mean the data isn't volatile or that it's perfect – but it's much easier to cross reference these different data sources to try and make an assessment on the US economy. That's not something you can really do in Australia or China.
So what do we know?
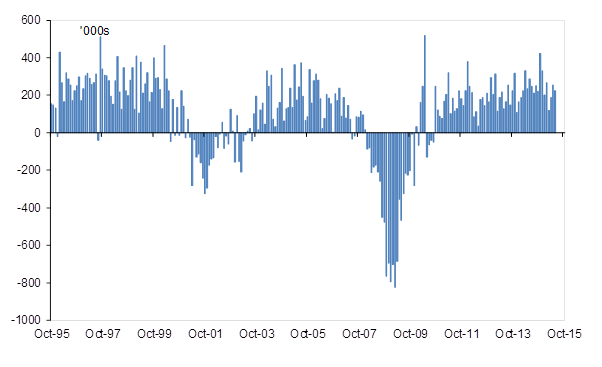
Well, we know jobs growth is very strong. Check out chart 1, it shows monthly US jobs since late 1995. A lot of jobs were lost during the GFC. All these losses have been recovered though – and more. Nearly three million jobs have been created just over the last year – close to 250,000 per month. As a result the unemployment rate is now at 5.3 per cent which is the lowest since the GFC and smack bang on the average recorded prior to the GFC.
Chart 1: US jobs growth the best since the 1990s
That's a great outcome, but two factors take some of the shine out of the figures.
Firstly, wage growth is low, and then secondly, underemployment rates remain high. Indeed at 10.5 per cent underemployment remains well above the average of 9 per cent. This may go some way in explaining why some Americans don't feel like things are getting better.
Yet, and while neither of those outcomes is great, it's important to remember that they don't paint a picture of an economy that is weak either. Why? Because both of these negatives are themselves on the mend. Wage growth for instance looks to be accelerating (albeit slowly), with an annualised average growth rate of 2.4 per cent – just below average. Similarly, underemployment is improving rapidly, down from 12 per cent last year and a peak of 17 per cent during the GFC. Things are getting better on both those measures.
How does this strong jobs growth gel with other key economic data points produced by other US agencies like GDP etc?
Quite well is the short answer.
Even on the headline growth figures, the economy is doing okay. Maybe not as well as the jobs figures suggest, but okay nevertheless – with GDP of 2.3 per cent in the year to June. Now that may not look like a particularly strong figure, and it's not. Then again it's only just below the average of 2.4 per cent since 1990. Even growth in the lead up to the GFC averaged only 2.4 per cent.
This headline figure hides some of the underlying strength in the US economy though. The numbers have been thrown around by very volatile swings in weather, inventories, government spending and trade figures. So for instance late last year, growth was over 4 per cent. In the March quarter of this year it was as low as 0.6 per cent (smashed around by weather).
Estimates of growth in the private economy have been less volatile – consumer spending, housing and business investment. Growth here shows the true state of the US economy and helps to explain why jobs growth has been so strong.
Chart 2: Private demand in the US is strong
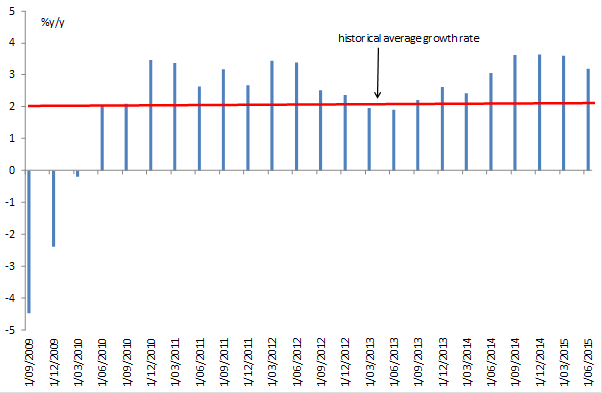
Basically that's because, and as you can see from the chart, the private sector is growing at a very strong rate – and well above average.
Some data points show a slowing – is that just volatility?
So far it's so good, but to be fair, not all of the recent data flow has been positive. Some key data points are actually showing some weakness – especially on the industrial side. That's why there is some debate about the real health of the economy.
Growth in industrial production for instance has slumped, annual growth rates over 4 per cent seen last year now down to 1.3 per cent. In fact production has declined in five of the last six months. Similarly, new orders for durable goods are down nearly 1 per cent over the year and even retail sales have slumped, growth rates of 1.4 per cent this year down sharply from rates over 5 per cent in 2014.
The issue is whether we should be worried by these data prints or not. On that score, the decline in the industrial production and durable goods figures is concerning and notionally points to a slowdown. Moreover they appear consistent with a range of private and public sector manufacturing activity surveys that suggest growth has slowed. Having said that, these indicators don't suggest the industrial sector is contracting – just a slowing in growth.
On the other hand, weak retail sales numbers don't look too ominous when you dig deeper. Especially as they are being distorted by plunging petrol prices and soft inflation. Correcting for those shows a much healthier spending picture – well above average.
What do the leading indicators say?
This brings us to the vast array of leading indicators, provided by a number of different organisations. Leading indicators are those data points that are used to try and forecast where the economy is heading over coming months. Things like:
- New claims for unemployment insurance: These are currently at their lowest since 2000 and then 1973 before that. They suggest the labour market will continue to get stronger and healthier.
- The ISM manufacturing index: This has come down sharply over the last year from 58 to 52.7. The thing is, that still shows the manufacturing sector accelerating, just at a slower pace.
- The service sector index: The service sector index conversely is close to a record high – and is up sharply over the last year. This points to a very strong acceleration in the service sector (roughly 70-80 per cent of the economy).
- Housing starts: Similarly new housing starts have surged – up 26 per cent over the last year and at their highest since 2007. This suggests a strong uplift in housing construction that will boost jobs and lift economic growth more broadly.
- Consumer confidence: This is roughly at average levels. There are two key indexes here, complied by two different private sector organisations. One suggests confidence is just below average, the other just above.
Are these the best of times for the US economy? No, we can't say that. There are still some legacy issues around the quantity of debt, underemployment is high, wages are low and manufacturing has slowed. Having said that, these are certainly not the worst of times though and most of the economic statistics show an economy that is quite healthy and getting healthier as time goes on. In many ways the US economy is doing better than it usually does, compared to historical averages.
Can we trust the figures? More than any others I would suggest. The data points mentioned above come from a variety of sources and are compiled by diverse group of public and private sector agencies. When we put them together the picture painted is very good. That doesn't mean it's great for everyone – and it doesn't mean that some businesses aren't failing or that some people are finding it tough to get a job. Just that in aggregate, the US economy as a whole is doing well.


