The Solar Attractiveness Index
Australia has long been considered among the world leaders when it comes to solar thanks to an amazing resource and some accommodating – albeit inconsistent – policies. It is, of course, hard to compare country-to-country, but that shouldn’t stop anyone from trying. All of which brings us to our charts of the week, courtesy of the European Photovoltaic Industry Association.
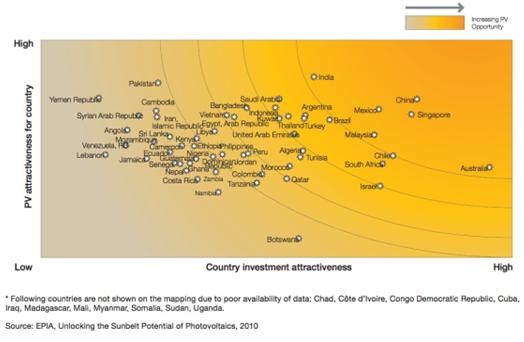
As shown below in the opportunity mapping chart, Australia stacks up incredibly well compared to the rest of the world's 'Sunbelt countries'. While it suggests there’s much more growth to come for Australian solar, it also highlights the potential in emerging markets like China, India and Brazil. Given their relative standing amongst Sunbelt countries, it’s easy to see why there are expectations these countries will dominate industry growth in coming years.

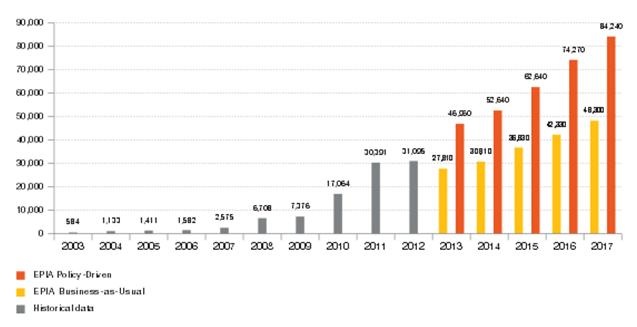
In a wide ranging report, the EPIA also forecast global solar demand across the next five years and while the next two years should prove challenging, the following three should see rapid growth. Under the business-as-usual forecast, annual demand is expected to surge to around 48 GW in 2017 from 31 GW in 2012. While the more optimistic 'policy-driven' forecast, sees demand at 84 GW in five years' time.

The full report can be found here.


