The bell tolls for a margin debt catastrophe
Increasing confidence in a bull market, historically, is a reason to ring the alarm bells. When markets are persistently clearing record highs and people are leveraging to the hilt amid a fear of missing out, it’s rarely more than a year until it all comes crashing down.
With that as a backdrop, one largely overlooked piece of data released last week presented reason to approach the next 12 months with an air of trepidation: margin debt.
Records have been bested regularly over the past year, according to data sourced by the New York Stock Exchange, in eerily similar circumstances to the last bull market -- when new margin debt peaks were reached for seven straight months over 2006/07 before topping out in 2007. Around 15 months later we were in the midst of the worst financial crisis since the Great Depression.
This time around we have witnessed eight straight months of records. In only one other period in the last 20 years have the stats shown eight consecutive months of expansion in margin debt: June 1999 to March 2000 -- just prior to the collapse of the tech bubble.
It’s easy to tuck it under the carpet by putting it down to increased activity from beefed-up hedge funds, as JPMorgan analysts hinted in February, or to wave it away because the rise beyond previous peaks hasn’t been as swift as that seen ahead of the last two crises. But at some stage a wall of borrowed money will crumble and then we will ask, why didn’t we see the signs?
The cracks may even have started to appear at the end of last week -- and perhaps widened slightly overnight.
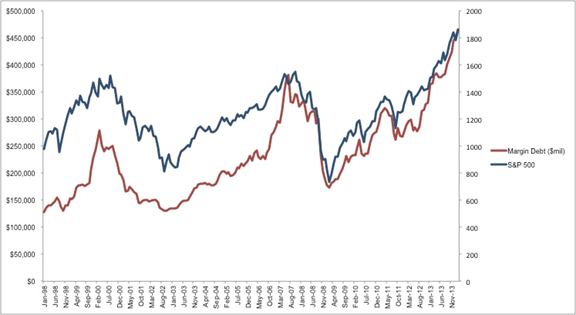
The graph below illustrates how margin debt has become a major part of investors’ arsenal over the past 15 years, with three notable peaks: around 1999/2000 (it burst with the tech bubble), in 2007 (it collapsed with the global financial crisis) and today (the S&P 500 is flirting with all-time highs).

Graph 1: Margin debt vs S&P 500; 1998-2014.
History tells us a correction of 10 per cent or more is imminent. Indeed, the previous two times margin debt has soared to new heights, investors were soon bracing against a 40 per cent-plus crash. The more margin debt rises before we reach a correction, the scarier it threatens to be.
The biggest difference this time is the continued easy money policies of the Federal Reserve, which serve to encourage investors to utilise margin debt given the low rates on offer.
One of the more hawkish voting Fed members, Dallas Fed chief Richard Fisher, recently delivered a cautionary note that touched on the dangers of margin debt and other warning signs flashing red in the market. The comments were grimmer than any of his colleagues have presented to date on the risks of the Fed’s policies.
“There are increasing signs quantitative easing has overstayed its welcome: Market distortions and acting on bad incentives are becoming more pervasive,” he asserted.
“Stock market metrics such as price to projected forward earnings, price-to-sales ratios and market capitalisation as a percentage of GDP are at eye-popping levels not seen since the dot-com boom of the late 1990s. Margin debt is pushing up against all-time records… We must monitor these indicators very carefully so as to ensure that the ghost of ‘irrational exuberance’ does not haunt us again.”
He went further by agreeing with Financial Times writer James Mackintosh in declaring “a not insignificant number of stocks in the S&P 500 have valuations that rely on belief in a financial fairy.”
The Mackintosh article noted that before the two previous market crises there had never been more than 25 stocks in the S&P 500 trading at both more than 10 times book value and over 20 times forward earnings. Today there are 33, leaving us in uncharted waters.
Casting a further shadow is the fact there has been no time in history when markets have traded at record highs and central banks were acting as if a major crisis was still afoot.
A federal funds rate of 0-0.25 per cent was unheard of before we got to the depths of the financial crisis. To think the US is still there over five years later while the S&P 500 and Dow are ploughing new heights and corporate debt and margin debt levels are jumping to fresh peaks, beggars belief.
Understanding the leverage that has forced the market to those peaks must force investors to take a deep breath. If not, the next collapse will be one for the record books.
Daniel Palmer is Business Spectator's North America correspondent @Danielbpalmer


