Taking stock of Wall Street's boom
If the US economy was performing as well as the US stockmarket, even Walmart workers would be breaking out the champagne.
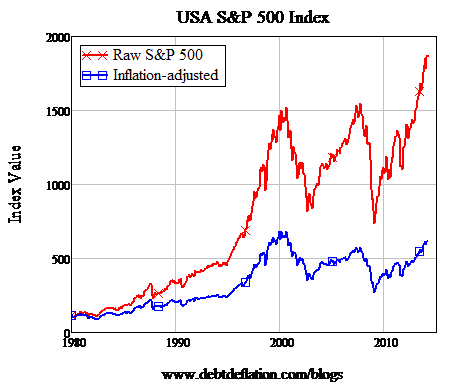
Since 2009, the S&P has risen over 250 per cent in nominal terms, and almost 230 per cent in inflation adjusted terms. In nominal figures, it is at its highest value ever, though when you adjust for inflation, it is still 10 per cent below its peak in 2000 (see Figure 1).
The $64 question is: will it keep on going up?
Figure 1: The S&P 500 before and after inflation

There are good reasons for the stockmarket index rising over time in inflation-adjusted terms. These include sound ones like the reinvestment of earnings (think Berkshire Hathaway), but also misleading ones like survivor bias.
The index keeps rising because it represents the biggest 500 companies in the USA, and stragglers (let alone the bankrupt) are dropped from the index over time. So it represents an unattainable ideal (except for Berkshire Hathaway): you could only do as well as the index if you could predict in advance who was going to drop out of it, and who their replacements would be.
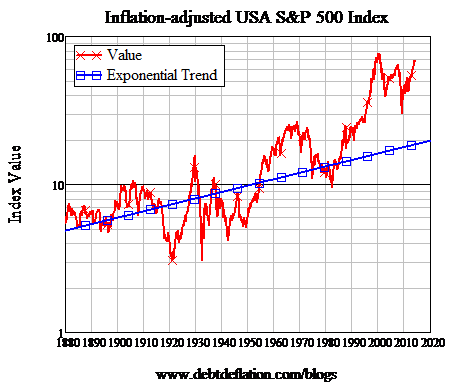
But even given that, the index has got ahead of itself on several indicators. A simple one is a comparison of its current value to that (unattainable, except for Berkshire Hathaway) trend over time.
The market is both well ahead of it and moving away from it at present (see Figure 2). Is this just the ‘new normal’ post 1985, or it is a bubble?
Figure 2: The trend and above-trend behaviour

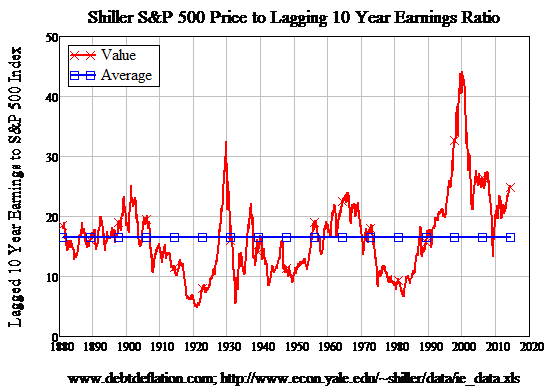
The best guide is Robert Shiller’s price to lagging 10-year earnings ratio, which compares the earnings of the current S&P 500 companies over the preceding 10 years to their share price today. The 10-year time frame irons out booms and crashes over time (and eliminates crash-and-burn companies as well), and effectively lets us compare apple trees with apples: are we paying more for apple trees now, relative to their yield in apples, compared to 1900?
Over the last 130 years, the average value was 16.5; the current value is 24.9. The only times it was higher than this were 1929, 1966, 2000, and the period from 2004 till 2007 -- all bubble periods that were followed by sharp crashes.
Shiller’s timing in writing Irrational Exuberance in 2000 looks even better in hindsight than it did at the time. 2000 stands out as the biggest bubble in share market history.
And indeed the whole period from 1990 untll now is above the long-term trend, with the sole exception of mid-2008 till mid-2009 when it appeared that the sky was falling as the S&P plunged from 1550 to 750. Actually, the index was just returning briefly to its long term trend.
At least there was a boom going on in the real economy in 2000 and 2007. Why on earth is the market reaching boom valuations today, when the real economy is still in the doldrums compared to 2000 and 2007?
One reason is certainly that identified by Shiller (irrational exuberance), but fuelling that exuberance are the twin factors of public meddling and private debt: the former in the guise of QE and the latter in the form of margin debt. I’ll consider QE today, and discuss margin debt in next week’s column.
Figure 3: Shiller's long-term perspective on share valuations

The impact of QE on stock prices is much debated, but the Bank of England’s recent explanation of how bank lending expands the money supply also settles that debate by explaining how QE has helped inflate the stock market. It starts with purchasing bonds from “non-bank financial companies” :
“QE has a direct effect on the quantities of both base and broad money because of the way in which the Bank carries out its asset purchases. The policy aims to buy assets, government bonds, mainly from non-bank financial companies, such as pension funds or insurance companies…” (Bank of England Quarterly Bulletin Q1 2014)
QE is colloquially called “printing money”, which implies that the Federal Reserve is shipping truckloads of dollar bills to bank tellers, who are then handing it out to the public. In general that’s a totally misleading metaphor, since (a) it’s not printing dollar bills and (b) it’s not giving them to the public either.
But it is not an entirely misleading metaphor for what it’s doing to stock markets, since (a) it is buying bonds off companies that exist to buy and sell assets and (b) once the Fed has bought bonds off them, those companies are likely to use that money to buy shares instead:
“The sellers of the assets will be left holding the newly created deposits in place of government bonds. They will be likely to be holding more money than they would like, relative to other assets that they wish to hold. They will therefore want to rebalance their portfolios, for example by using the new deposits to buy higher-yielding assets such as bonds and shares issued by companies — leading to the ‘hot potato’ effect discussed earlier. This will raise the value of those assets and lower the cost to companies of raising funds in these markets. That, in turn, should lead to higher spending in the economy.” (Bank of England Quarterly Bulletin Q1 2014)
The ‘non-bank’ aspect of QE is vital, because if QE involved buying assets solely from banks, then very little would happen to the stock market -- or the real economy -- because it wouldn’t inject any money into the economy.
That’s because money is the sum of what’s in our pockets (which is trivial) and what’s in our bank deposit accounts (which is huge). For QE to increase the amount of money in the economy, it has to increase deposits, which are liabilities of the banking sector.
If the Fed (or the Bank of England) buys bonds from private banks, then the private banks sell one asset (bonds) and get another in return (reserves), but their overall level of assets remains constant.
This can result in them having reserves that are massively excess to their requirements (since the main function of reserves is to enable banks to deal with each other) and some banks might use part of those to buy shares, but it injects no new money into the economy. On the other hand, when the Fed buys bonds from non-bank financial companies, this does inject money into deposit accounts.
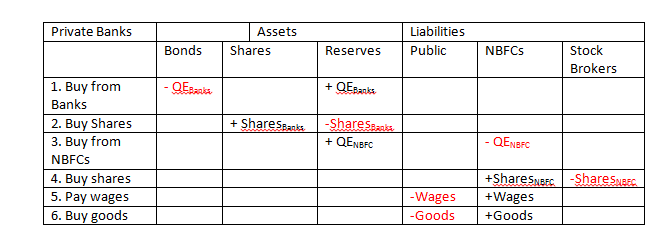
Figure 4 and Figure 5 show the basic mechanics of QE, and why the bank/non-bank distinction is vital (they use the convention I use in my Minsky program, of showing assets as positive and liabilities as negative, and all flows going from plus to minus).
From the point of view of the central bank’s ledger (Figure 4), the two operations look the same: whether the Fed buys from banks (QEBanks) or non-banks (QENBFC), the Fed’s holdings of government bonds rise, (increasing its assets) and the reserves of private banks rise by the same amount (increasing it liabilities).
Figure 4: QE on the central bank's books
Figure 5: QE on the private banks' books
Buying bonds off NBFCs (which is shown on rows 3 and 4 of Figure 5) increases the assets of the banking sector by increasing its reserves, and it also increases the banking sector’s liabilities as well, by increasing the amount of money in the deposit accounts of NBFCs. This increases the amount of money in circulation in the economy. The vast majority of it will end up in the share market, since the NBFCs will use their increased amount of cash -- an idle (or low-earning) resource-- primarily by buying other resources like shares.
My friend Michael Hudson summarises this effect by saying that “the QE helicopter drops dollar bills on Wall Street, not Main Street”, and that’s pretty apt.
Some of that extra money does go to extra salaries to and purchases from Main Street (rows 5 and 6), but in the main the extra money created by QE will end up in the stock market. This is a major reason why Wall Street is doing so much better than Main Street, even though QE is marketed as a tool to boost the real economy. QE is a pretty roundabout and ineffective way of achieving the supposed aim of leading “to higher spending in the economy”.
It’s also one of the main reasons that might make 2014 a less than stellar year for the stock market. If the Fed tapers, then this additional source of demand for shares will dry up, let alone if it actually tries to unwind QE, in which case the whole process will run in reverse: selling bonds to NBFCs will reduce the amount of money they have and may well result in them selling shares.
And this in turn might trigger those holding margin accounts to sell as well -- an effect I’ll discuss next week.


