Special report: Electricity demand collapse - Part 2
This is part 2 of a special report into Australian electricity demand, part 1 can be found here.
Australian electricity demand forecasts through the rest of the decade are in need of a sharp revision, in the order of 10 per cent on the forecasts from last year that were around 10 per cent below the year prior.
The lags on demand are now so strong, so historically unique that few are realising how quickly it is turning the electricity generation sector on its head.
Part of this is due to the long-held viewpoint of a positive correlation between electricity demand and economic growth. That correlation no longer applies in Australia thanks to technology improvements, solar proliferation and an economic shift away from manufacturing.
The graph below tells the most powerful tale. Since the second half of 2010, demand has been trending down, relentlessly.
Changes in electricity generation and emissions

Source: Pitt and Sherry CEDEX index
Contrast this with the forecasts from AEMO illustrated below. Note the red line – actual demand – and the yellow line – expected demand, on a medium economic growth scenario. Demand is forecast to revert back to its early-to-mid 2000s trend (that is, consistently going up) from financial year 2013/14. Already, just six months after the forecasts were released, that appears exceedingly optimistic.
Annual energy forecasts for the NEM
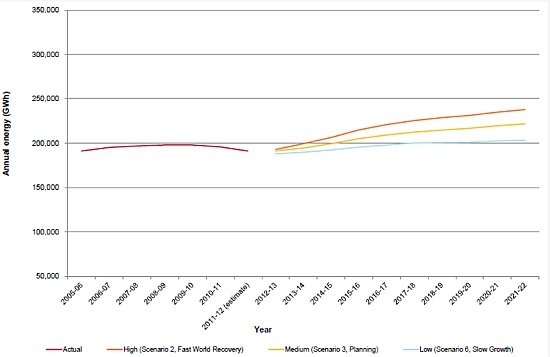
Source: AEMO 2012 National Electricity Forecasting Report
AEMO boss Matt Zema has noted that the first year demand fell was put down to the GFC, the second down to cooler conditions and so it was only the third year that he said anyone really started to think ‘hang on, there’s a trend here’. All of which means that everyone is still playing catch-up in understanding the game has changed.
Forecast demand change from 2011 to 2012
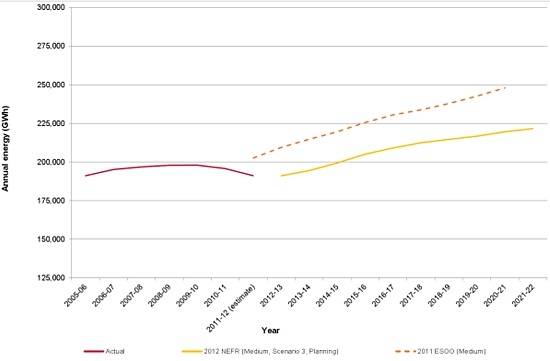
Source: AEMO 2012 National Electricity Forecasting Report
Large users on the outer
The darkest chapter in the demand story for those in the industry is not even written yet.
What would happen, for instance, if all of Australia’s aluminium smelters shut down in the next decade? It’s not an entirely far-fetched hypothetical.
After the Kurri Kurri closure last year, we have five smelters left in operation, accounting for between 10 and 15 per cent of NEM demand.
Point Henry is as good as gone come mid-2014 unless the government steps in with (further) significant support. Portland could be facing a similar fate when its current bargain basement electricity price contract expires in 2016 (it has another contract through 2028, but not on the same generous terms). Bell Bay in Tasmania is up for sale by Rio and has seen significant losses since the GFC. The Tasmanian government is desperate for it to continue operation, but even the newly signed power agreement mightn’t be enough.
If you lost just those three smelters, over 4 per cent of electricity demand would be wiped out.
Then there’s the Tomago smelter in New South Wales and Boyne Island in Queensland. Both of these are likely on sounder financial footing than the others, which isn’t necessarily saying a lot. Like Bell Bay, they are up for sale and given the industry’s struggles, futures can’t be guaranteed through to 2020.
If they went to the scrapheap as well then the cut for electricity generators would have turned into a gangrenous wound.
Tomago alone accounts for 10 per cent of electricity demand in New South Wales, and approximately 3.8 per cent of NEM demand. Boyne Island, the largest by capacity, would have a similar impact on NEM demand. If they all closed, close to 12 per cent of demand would be eliminated without replacement.
Solar PV
As mentioned in the first part of this series, AEMO’s solar forecasts – released around the middle of 2012 – are already off the mark. Solar may be two years ahead of the ‘medium uptake’ schedule by the end of this year alone.
Rooftop PV installed capacity forecasts for the NEM
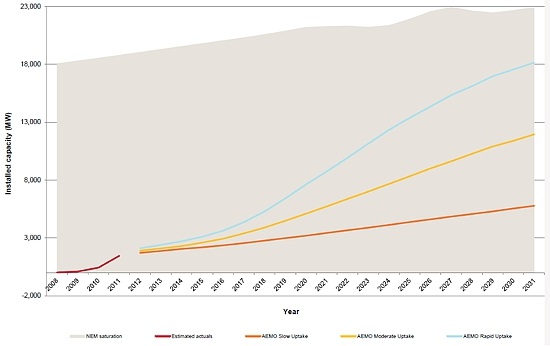
Source: AEMO Rooftop PV Information Paper
Predicting solar is fraught with danger as there’s so many factors to take into account. No one, for instance, expected panel prices to decline by upwards of 80 per cent in three years. The policy flip-flops also play a significant role.
But given AEMO has such a low demand forecast in the near-term – 320 MW a year until 2018 (we should be doubling that this year) – it’s a reasonable expectation to think we could further outstrip its forecast by 1.5 GW in the forecast period. As such, AEMO’s expected solar demand by 2020 looks around 2 GW short of where it should be. This equates roughly to 2,600 GW/h, or another 1.4 per cent of demand compared to forecast.
The upside potential is vast, with commercial installations the sleeping giant. Australia is different to much of the world in that residential customers claim almost all of the solar market. If the commercial sector jumped on board, who knows how high demand could rise.
Energy efficiency
Energy efficiency is also underestimated as AEMO largely did not take into account the potential for improvements in the commercial and industrial sectors (outside NSW and the ACT). This was due to a lack of data available, but looking at the chart below and given residential only accounts for 30 per cent of demand, you can see there’s real potential for an enhanced impact compared to expectations.
Annual energy impact forecasts of energy efficiency policy by NEM region
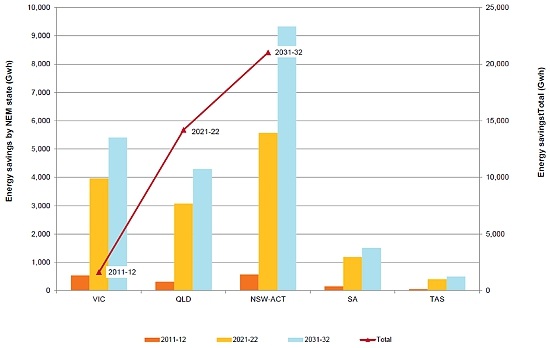
Source: AEMO 2012 National Electricity Forecasting Report
The case can also be made that energy efficiency is already underestimated in terms of its likely impact given the sheer numbers of minor changes individuals and businesses can make that would be incredibly challenging to keep track of. This includes adding solar water heaters, better insulation of new buildings, upgrading any number of appliances – lights, TVs, air conditioners, fridges, washing machines, dryers –the list goes on.
The AEMO energy efficiency forecasts focus on the impact of government policy rather than possibilities surrounding individuals and businesses deciding to upgrade their appliances (to more energy efficient models).
Like solar’s inclusion in AEMO’s forecast in 2012, this energy efficiency methodology was a first for AEMO last year meaning there’s still plenty of work to be done to fully assess the impact of energy efficiency measures on demand (an article in Climate Spectator today highlights, for instance, the staggering impact of 5-star housing on electricity demand).
Overall
If you add these impacts up, you are looking at an underestimate of energy efficiency impacts in the order of at least 2 per cent, then 4 per cent for the most vulnerable smelters being subject to closure and 1.4 per cent for solar exceeding moderate expectations.
Around 7.5 per cent all up. Add in further manufacturing weakness, a slowdown in the mining boom, factor in growth not being as reliable an indicator (which is incredibly important for modeling, but can’t be quantified) and you easily get beyond 10 per cent.
Very quickly a case can be made that despite economic expansion and population growth, NEM demand in 2020 may be no more than the levels we see today. A strong case can even be made for it to be lower than it is today, flying in the face of forecasts for an average yearly growth rate of 1.7 per cent through the rest of the decade. If all the smelters closed it would then be catastrophic for generators, if it isn’t already.

