Solar PV Price Check - July
The Solar PV Price Index for July 2013 shows average solar installation prices dropping in the ACT across all system sizes. Prices have also fallen across the board for Melbourne, albeit not as sharply as in Canberra. In most other cities and among most system sizes greater than 1.5kW, prices have either declined or remain steady.
Average solar system cost by city and nominal system size
The table below contains the average solar system installation prices for the seven Australian capital cities. Sydney and Perth, in line with previous months, remain the two cities with the lowest average install costs. Hobart still has the highest average prices.
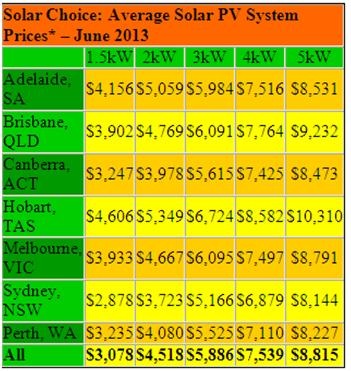
*Incorporates federal STC discount
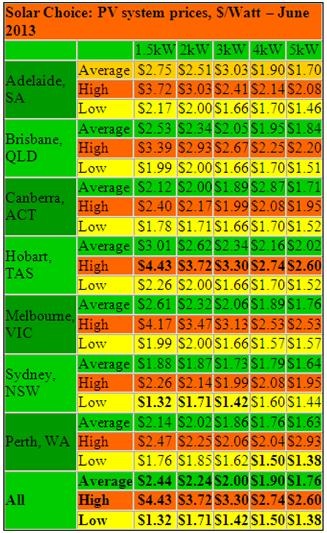
July 2013 solar system prices: $/Watt averages, highs & lows
The following table contains pricing figures for 1.5kW, 2kW, 3kW, 4kW and 5kW solar systems in the seven cities that are included in the index. Federal STC discounts are incorporated in these figures.
This month, STCs accounted for an effective discount of around 68c per watt in Adelaide, Brisbane, Canberra, Sydney, and Perth. In Hobart and Melbourne this discount worked out to around 54c/W (down slightly from 56c/W last month). These STC discount figures are calculated based on the numbers provided by installers, when included in system pricing.
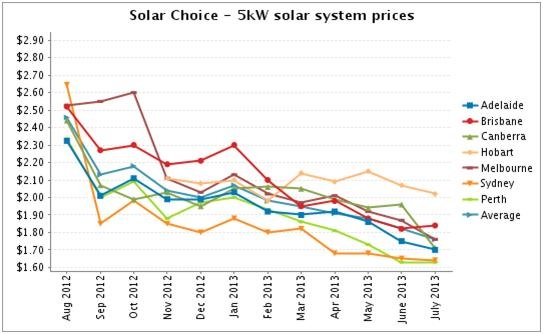
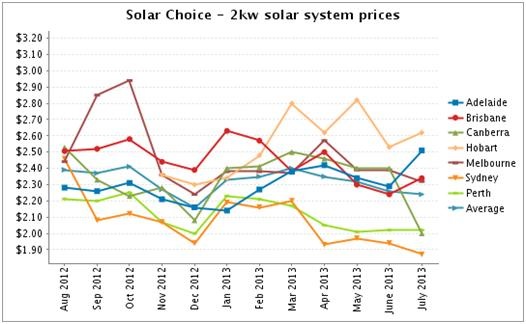
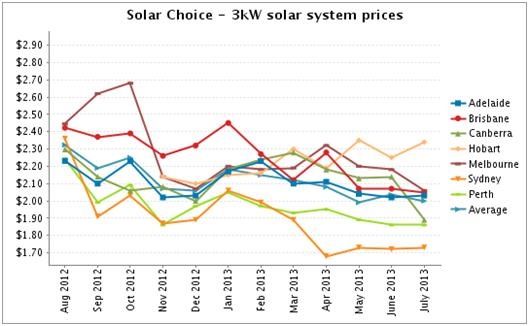
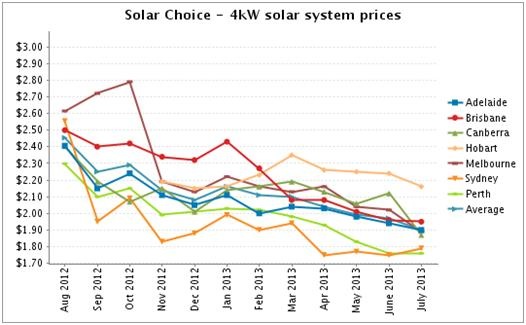
Historic solar PV system prices to July 2013
Since last month, prices in the ACT have dropped sharply among all system sizes (1.5kW-5kW) following the closure of ActewAGL’s 1-for-1 gross solar buyback scheme to new applicants. Prices for larger system sizes (4kW, 5kW) in most of the other the other six cities included in the index continue the gradual decline that has been observable since the beginning of 2013, while smaller systems have increased in price in a number of instances.
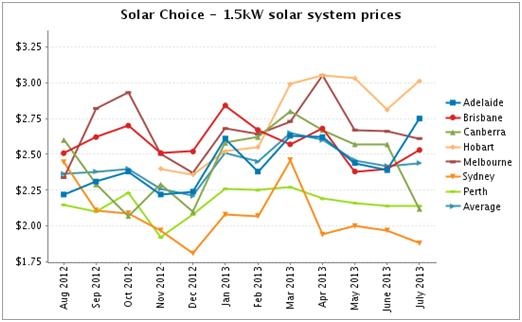
About this data
Tables and charts included in this article were created using data from Solar Choice’s installer network database, which contains regularly-updated pricing and product details from over 125 solar installation companies across Australia. Prices do not incorporate meter installation fees or additional costs for difficult installations. The discount available to Solar Choice customers is also excluded from the calculations, as are prices for ‘premium’ installer offerings.
This article first appeared on the Solar Choice website. Republished with permission.


