
Sell in May and go away? The Australian story


- {{x.value}}
{{ twilioFailed ? 'SMS Code Failed to Send…' : 'Enter verification code' }}

{{ completedStep1 ? 'Authentication & Security' : content.trialHeading.replace('{0}', user.FirstName) }}

{{ content.upgradeHeading.replace('{0}', user.FirstName) }}
The email address you entered is registered with InvestSMART
Please login to continue
We have sent you an email with the details of your registration.
Looks you are already a member. Please enter your password to proceed
{{ upgradeCTAText }}
Updating information
Please wait ...
Your membership to InvestSMART Group recently failed to renew.
Please make sure your payment details are up to date to continue your membership.
Having trouble renewing?
Please contact Member Services on support@investsmart.com.au or 1300 880 160
You've recently updated your payment details.
It may take a few minutes to update your subscription details, during this time you will not be able to view locked content.
If you are still having trouble viewing content after 10 minutes, try logging out of your account and logging back in.
Still having trouble viewing content?
Please contact Member Services on support@investsmart.com.au or 1300 880 160
Please click on the ACTIVATE button to activate your Intelligent Investor 15-day free trial
Please click on the ACTIVATE button to finalise your membership
Unsuccessful registration
Registration for this event is available only to Eureka Report members. View our membership page for more information.
Registration for this event is available only to Intelligent Investor members. View our membership page for more information.
- You are already registered for this event.
- This event is already full.
- Please select a quantity for at least one ticket.
- {{ i }}
Forgotten password
Please enter your email address below to request a new password


- Verify your email address by clicking on the link we sent to {{user.Email}}
- You now have free access, we look forward to helping you on your financial journey.

Summary: The US stock market has historically risen more during the November to April period than the May to October period. Australia typically lags America by one month, but rebounds in July and August, making it more complex to use seasonal patterns to time share index funds. |
Key take-out: Trend-tracking and momentum-measuring systems offer another way to time the market, since using set seasonal formations is hazardous. |
Key beneficiaries: General investors. Category: Shares. |
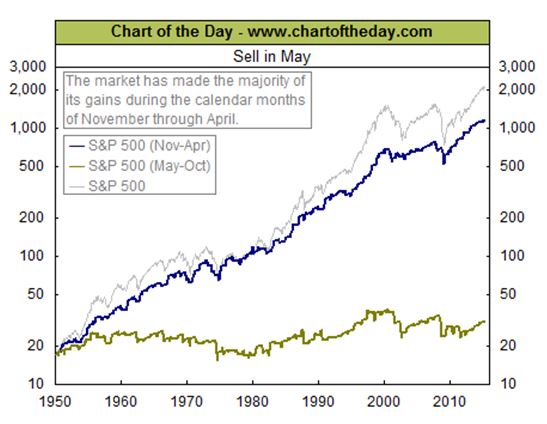
There's an old stock market adage: “Sell in May and go away, buy again on St Leger's Day.” Such a seasonal strategy is based on the historical underperformance of shares in the six-month period commencing in May and ending in October, compared to the six-month period from November to April. 9. (St Leger's Day by the way is in September, usually around the 15th of the month – it was named originally after a UK horse race.)
According to the Stock Trader's Almanac, since 1950, America's Dow Jones Industrial Average share index has had an average return of only 0.3 per cent during the May-October period, compared with an average gain of 7.5 per cent during the November-April period.
The Dow Jones index's average performance for each calendar month since 1950 (blue columns) is shown below.
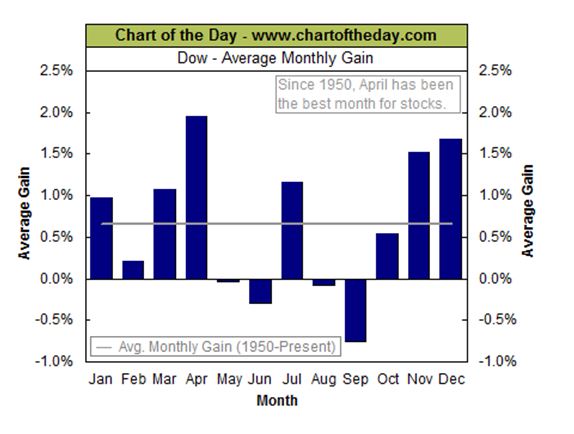
As can be seen, the US stock market normally does well in the early part of the year with April the standout month. From May, performance on average is negative for five months except for a strong July. And from October it's bullish again.
The next chart by AMP Capital compares American and Australian share indices from 1985 to 2013. As can be seen Australia lags America by one month. Our market typically peaks in May and dips in November yet rebounds in both July and August.
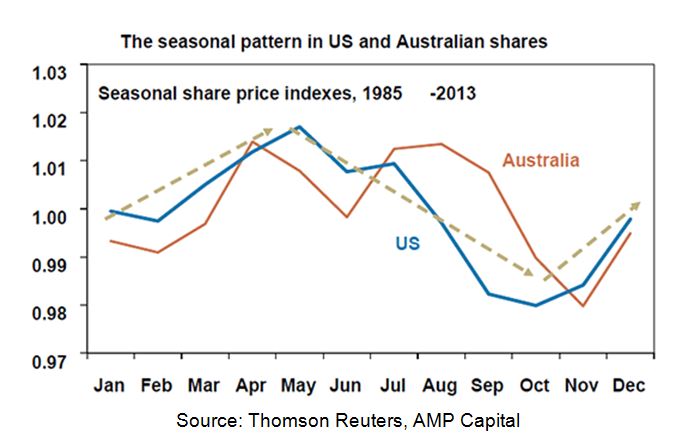
So using seasonal patterns to time share index funds is more complex in Australia than America. Also these charts show average historical performance which does not reflect actual performance each year.
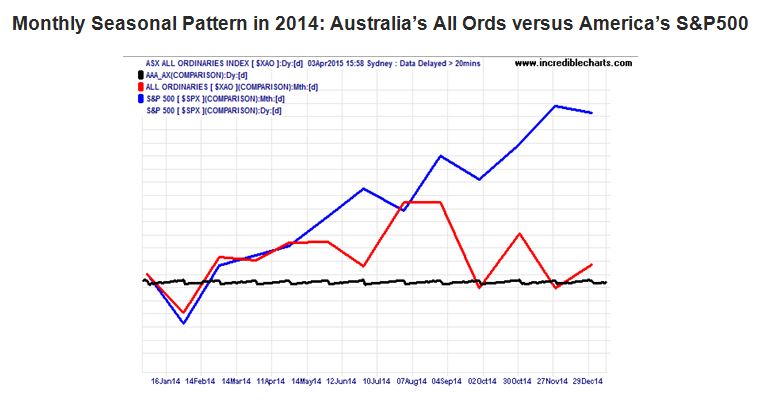
Take for instance 2014 when both the (red) Australian All Ords index and the (blue) American S&P 500 index performed poorly against the (black) cash index in January, but after that the American market went gangbusters and the Australian market went flat except for July and August when it had a dead cat bounce.
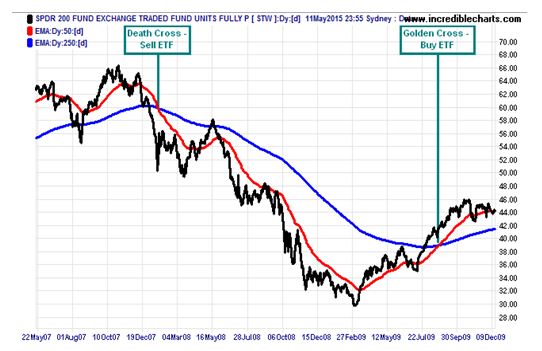
I normally explain trend following techniques such as trading a listed index share fund (such as the SPDR S&P/ASX 200 fund – ASX Code STW) when its medium term price trend (as shown by its 50 day moving average trend line) crosses over its long term trend (as defined by its 250 day moving average trend line). A “death cross” marks a sell signal and a “golden cross” a buy one. See illustration below.
But another way to time the market is to use momentum analysis. Indeed considerable research shows it repeatedly beats buying and holding a share portfolio passively (see this study, for example). And like trend-following it has an inbuilt ejector seat to avoid a market crash.
A simple and effective momentum model compares the percentage price increases over the last six months of a small field of exchange traded funds (ETFs) and always backs the one winning the race. This approach requires checking which ETF holds the lead after the close of trading each Friday and if it's overtaken by another ETF then waiting a week to confirm that outcome before switching to the new frontrunner.
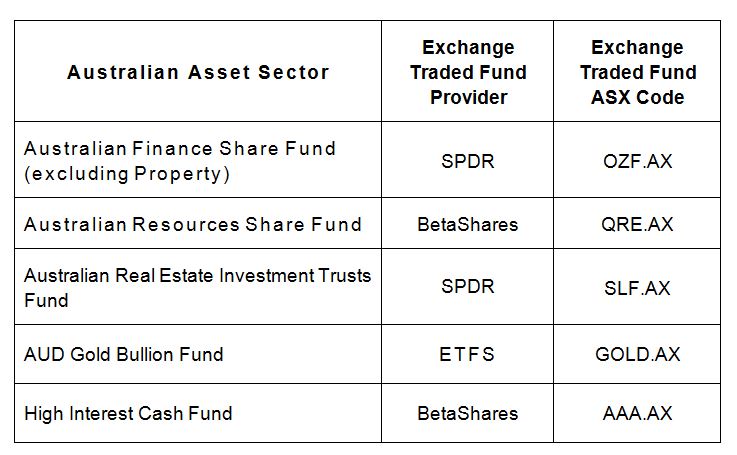
The following asset sector ETFs are suitable for such a rotation strategy. Three are aggressive bull market funds (finance, property and resources) and two are defensive bear market funds (cash and gold) so you can run with the bulls in good times and hunt with the bears in bad times.
Here is a chart of the six month relative price momentum of these five funds at present (you can generate such a picture on any share charting platform including the free one provided by Yahoo Finance).
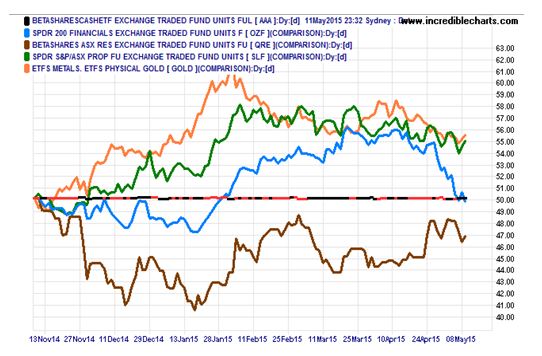
Notice that the (orange) gold fund (a defensive asset) presently shows the strongest percentage price increase over a six-month timeframe, beating the (green) property fund by a whisker.
Using MarketTiming's back-testing software developed by my colleague John McKee this six-month momentum-based ETF rotation strategy would have produced the following results since the five ETFs first existed as a group:
ETF rotation strategy trading results: November 2, 2011 to April 16, 2015
· Average returns (before dividends): 17.3 per cent per annum
· Average number of ETF switches: 4.3 a year
· Worst single trade drawdown: 4.0 per cent
· Total capital gain on $10,000 invested: $7,557 over 3.45 years
· Assumptions: 0.2 per cent brokerage per trade with an ETF being traded at its closing price the trading day after it comes into or falls out of favour.
So to bring it all together my suggestions are:
1. Be aware of the tendency for share markets to do better between November and April and worse between May and October (with Australia bucking this pattern in July and August)
2. Recognise that this seasonal pattern doesn't assert itself each year as we saw in 2014 when America escalated almost each month while Australia remained in the doldrums except for a temporary breakout in July and August.
3. Use “live” trend-tracking and momentum-measuring systems as I have discussed before (see my archive here) to catch waves and avoid busts in the share market since using “set” seasonal formations for timing the market is hazardous.
Our research shows that any momentum period between 6 and 12 months when used in the above ETF rotation strategy and portfolio produced good returns.
So why pay huge fees to a hedge fund to actively manage your money? After all you can do as well or better yourself.
Percy Allan is a director of MarketTiming.com.au. For a free three week trial of its newsletter and trend and momentum trading signals for listed ETF funds see www.markettiming.com.au.

