Rio on growth watch
| Summary: Rio’s position in the growth portfolio is under consideration given its lacklustre performance, particularly when compared against rival BHP Billiton. The dividend “growth rate” of BHP has been four times faster than that of Rio. |
| Key take-out: BHP has been able to grow its equity base, its profits and its dividends at a much faster rate than Rio over the last 10 years. |
| Key beneficiaries: General investors. Category: Growth. |
Rio, BHP and growth
Quite frankly the impairments announced by Rio last week of its aluminium and Mozambique coal assets have led me to reconsider whether Rio should retain its place in the growth portfolio. At the outset, let me state that there is no problem with owning major resource-based companies that focus upon returns on capital investment and therefore shareholder returns. While they are cyclical businesses, this can be offset by prudent management of capital. Indeed it is the managerial ability of a resource company to invest against the cycle, rather than with a cycle, that will ultimately hold it in good stead.
So to consider the performance of Rio, I have decided to line it directly up against BHP Billiton to determine the strength of Rio’s management performance against BHP’s over the last 10 years.
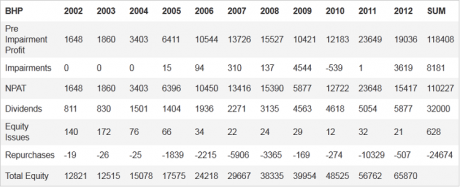
The first table shows that BHP has been able to grow its equity base, its profits and its dividends at a much faster rate than Rio over the last 10 years. Of course, when we consider the growth in equity we need to identify that it came from retained earnings (preferred) rather than new issues to shareholders. We will see this shortly.
| CAGR | RIO | BHP |
| Equity | 13.63% | 17.78% |
| Dividends | 5.37% | 21.90% |
| Pre Impairment Profit | 12.44% | 27.72% |
It is noteworthy that the dividend “growth rate” of BHP has been four times faster than that of Rio. Pre-impairment profit growth of BHP has been an excellent 28% compared to Rio’s more mundane 12%.
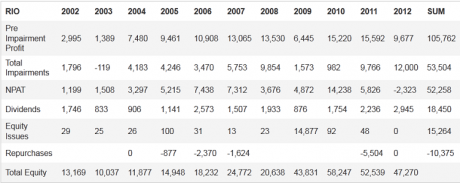
An interesting observation is that Rio’s profit growth is lower than its growth in equity over the 10 years. This indicates that the incremental returns on equity have been dropping. This is particularly shown by the subsequent and regular decisions of directors to provision against acquired assets that have produced inferior returns.
The next few tables shows that pre-impairment profits for BHP and Rio are similar over the last decade.
| 10 Yr Capital Flows | RIO | BHP |
| Pre Impairment Profit | 105,762 | 118408 |
| Total Impairments | 53,504 | 8181 |
| Dividends | 18,450 | 32000 |
| Net New Equity | 4,889 | -24046 |
| Change in Equity | 34,101 | 53049 |
However, the impairments made by Rio represent about 50% of reported profit. From an owner cash flow perspective, Rio has paid $18 billion of dividends but asked for a net $4.9 billion back. Therefore shareholders have only received a net $14 billion in cash distributions in 10 years. BHP blows this away, having a smaller 6% impairment to profit. The owner cash flows translates into $32 billion of dividends and $24 billion of capital returns. BHP owners have seen net flows to them of $56 billion, and this is very impressive.
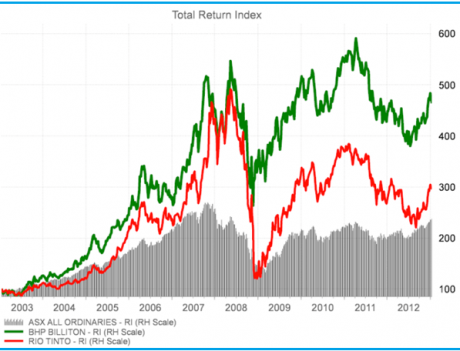
Finally, we can review the share price performance and dividends (total shareholder returns) of both BHP and Rio against the market and each other.
The total return of BHP against the market is truly impressive and absolutely abolishes the argument of some value investors who claim that resource companies cannot be in a value-based portfolio. Clearly, Rio matched the returns of BHP up until 2007, but its acquisition of Alcan and other investments have been abysmal. Shareholders can only lament the obvious waste of capital by the Rio management team.
Thankfully there are to be changes in management at Rio but that does not stop me from reviewing the soon-to-be released accounts to decide if Rio should stay in the growth portfolio.
BHP’s historic performance and its bright prospects suggests that it clearly deserves to maintain its place.
Equity markets have so far continued to consolidate in January after a very solid uplift in the December quarter.
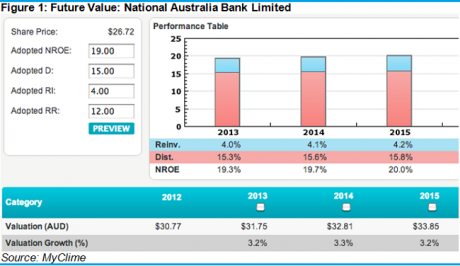
Both the income and growth portfolios continue to perform well and right now I am very happy with the timing of my decision to replace ANZHA with the introduction of National Australia Bank into the income portfolio as at 31 December, 2012.
Readers will remember that this decision was made because of my strong belief that income-focused investors must now reweight their portfolios towards growing yields. This is particularly so because of my view that the Reserve Bank will cut rates in the next three months. Thus, securities and hybrids that are priced at a slim margin to 90-day bills will see their relative yields tumble as quickly as those seen already in term deposits. While hybrids and income securities do present a lower risk profile then pure equities, their yields are affected by international monetary policy settings. It is clearly observable that the coordinated policies of international central banks have driven Australian interest rates down as quantitative easing perverts fixed interest markets.
Of course, timing is everything and the reports that the Spanish Bank Santander (since denied) was considering a £2 billion bid for NAB’s UK operations certainly helped propel NAB’s share price higher. However, at the time of purchase, NAB was the highest-yielding bank and was trading at the largest discount to my assessment of intrinsic value. The significant margin of safety made, and continues to make, NAB a compelling investment in the current market.
Clime Income Model Portfolio
Return since June 30, 2012: 18.14%
Returns since Inception (April 24, 2012): 16.95%
Average Yield: 7.89%
Start Value: $118,757.19
Current Value: $140,295.84
Clime Income Portfolio - Prices as at close on 24th January 2013 | ||||
| Hybrids/Pseudo Debt Securities | ||||
| Company | Current Price | Margin over BBSW | Running Yield | Franking |
| MXUPA | $83.00 | 3.90% | 8.29% | 0.00% |
| AAZPB | $96.80 | 4.80% | 8.04% | 0.00% |
| MBLHB | $69.01 | 1.70% | 6.78% | 0.00% |
| NABHA | $72.95 | 1.25% | 5.80% | 0.00% |
| SVWPA | $85.00 | 4.75% | 9.05% | 100.00% |
| WOWHC | $105.16 | 3.25% | 5.92% | 0.00% |
| RHCPA | $104.50 | 4.85% | 7.45% | 100.00% |
| High Yielding Equities | ||||
| Company | Current Price | Dividend | GUDY | Franking |
| TLS | $4.56 | $0.28 | 8.77% | 100.00% |
| AAD | $1.53 | $0.12 | 7.87% | 0.00% |
| CBA | $63.24 | $3.47 | 7.84% | 100.00% |
| WBC | $27.10 | $1.74 | 9.17% | 100.00% |
| NAB | $27.09 | $1.83 | 9.65% | 100.00% |
John Abernethy is the chief investment officer at Clime Investment Management.
Need help establishing an SMSF or just want to make sure you are doing everything right?
Clime is holding SMSF Information Seminars across Australia. Click here to register or view our event schedule.


