Research Roundup: Dividends, the ASX200 and domestic growth


Welcome to Research Roundup for this week, which looks at Aussie dividend payouts compared to the rest of the world, the ASX200, and domestic economic growth projections.
Janus Henderson: Declining Aussie dividends
Long known for sharing profits among shareholders, Australian companies have fallen behind the rest of the world when it comes to paying dividends.
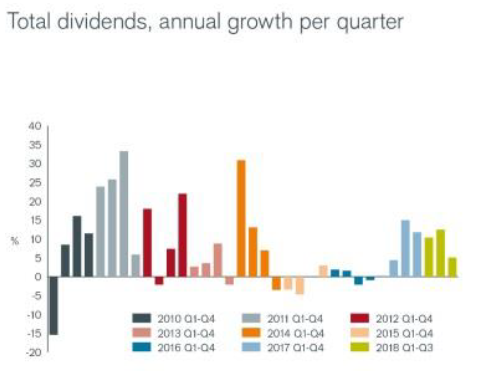
According to data released by asset manager Janus Henderson, dividend payouts in Australia decreased by 2.2 per cent in the most recent quarter – well below the growth figure of 5.1 per cent registered worldwide. The Aussie figures are not just a seasonal blip, with Janus Henderson noting that the third quarter in any given year is generally the one in which Australian dividends are highest.
In absolute terms, global dividends recorded in the third quarter of 2018 totalled $US354.2 billion – a record for this time of year, while Australian dividends paid equated to $US24.5 billion.
The report found that Telstra was the major offender among Australian companies, slashing its dividends by $US700 million compared to the corresponding period last year.
There was little to no growth in the dividends paid by the major banks and insurance companies, but shareholders of major mining and resources companies BHP, Rio Tinto and Woodside Petroleum benefited from sizeable dividend increases in the quarter.
Outside Australia, the US, Canada, India and Taiwan experienced record-high levels of dividends paid in a quarter.
The asset manager predicts that global dividends will amount to $US1.359 trillion for 2018, which would represent a growth rate of 8.5 per cent.
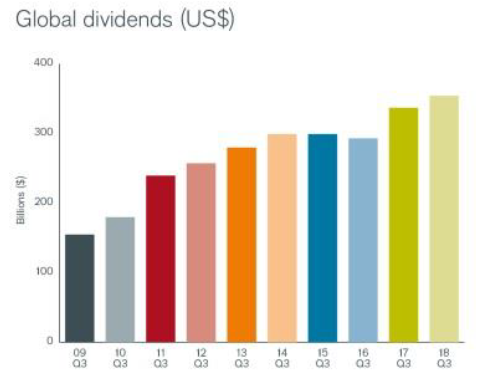
Source: Janus Henderson
Source: Janus Henderson
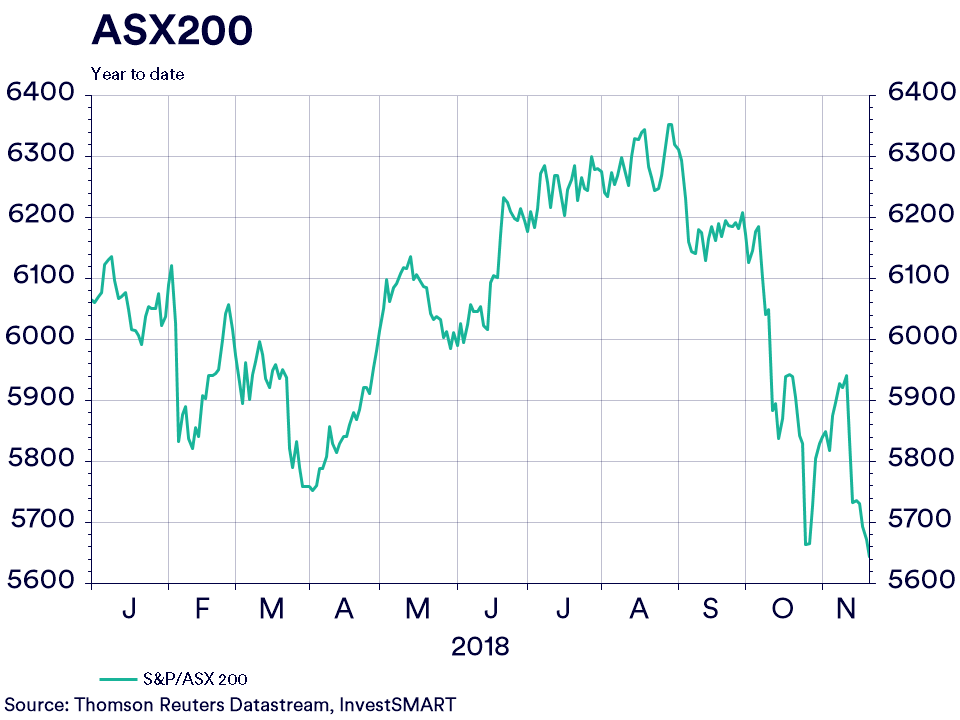
Reuters: ASX200 giving back gains
After a nightmarish October, and a confusing November so far, now seems like a good time to check up on the state of the ASX200, and how it has performed this year. As the chart below demonstrates, 2018 has certainly been a rollercoaster ride to date. After a strong middle portion of the year – which culminated in the index reaching its post-GFC high point in late August – things have fallen away significantly. In fact, about a month-and-a-half ago, the ASX200 once again ticked under its January 1 level, and – despite a brief rally late last month and earlier this month – as at Wednesday’s trading close, the index had reached its lowest mark for 2018.
Macquarie: Private health numbers may hurt hospitals
Macquarie has delved into the healthcare equipment and services sector, more specifically looking at hospitals, and how they may be affected by different healthcare statistics. One of the more prominent statistics evaluated by Macquarie is the percentage of Australians with private health insurance, which is illustrated in the chart below. As the chart shows, the proportion of the population with private health insurance has steadily decreased over a period of around three years. At this point, almost 47.5 per cent of Aussies had private health cover, with that number now only just under 45 per cent. The second chart below outlines the level of private health participation by state across the eastern seaboard. As Macquarie notes, private health participation in New South Wales is above the national figure, while the numbers in Victoria and Queensland have crept under 42 per cent, well below the national figure. The investment bank suggests that the smaller proportion of Australians with private health insurance may continue to work against companies such as Ramsay Healthcare and Healthscope.
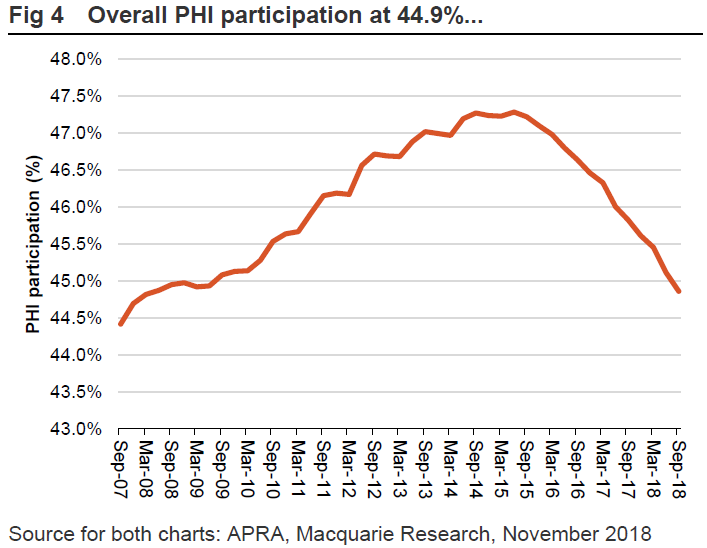
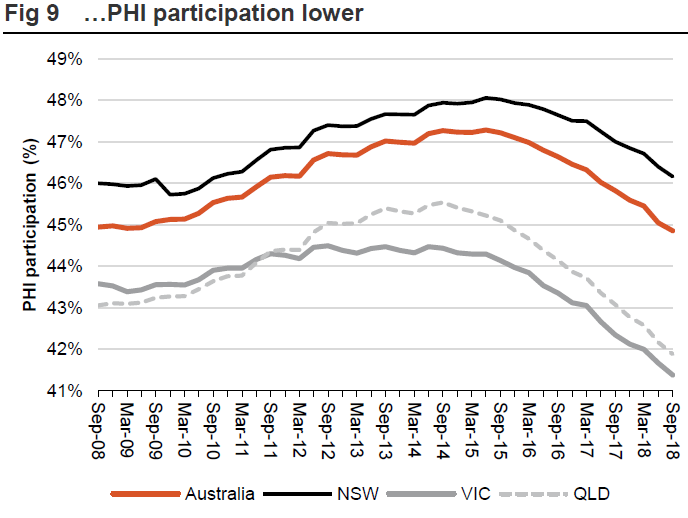
Source: APRA, Macquarie Research, November 2018
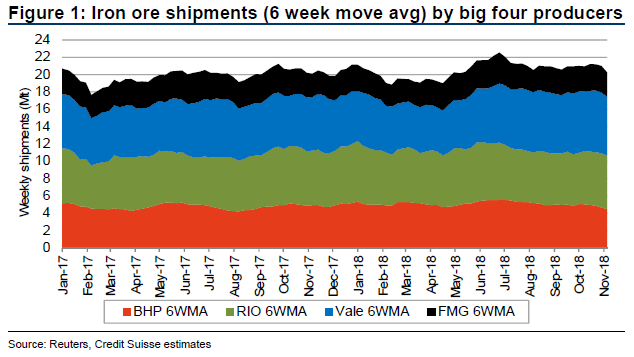
Credit Suisse: Iron ore to fall
Investment bank Credit Suisse has taken a look at the state of iron ore supply in Australia, breaking it down in terms of supply by each of the major Aussie iron ore producers: BHP, Rio Tinto, Vale and Fortescue. As the below chart shows, overall weekly shipments among these four companies have fluctuated throughout 2018, despite the fact that the current figure remains largely similar to that at the start of the year. On an individual producer basis, Credit Suisse notes that any increase in overall shipping numbers this year has been driven by Vale, while also pointing out that the decline in shipments by BHP and Rio Tinto over the last few months means the two behemoths may be reaching capacity. The investment bank is forecasting that the iron ore price will suffer a sharp decline from its current level of around $US75 per tonne before the end of the year, before remaining at a similar level on average throughout 2019.