Queensland's climb up the solar ladder
Queensland electricity company Energex recently released its monthly update on solar PV connection figures and as usual, there’s a fascinating story to tell.
With the calendar year almost over, we took a look at some of the forecasts for PV uptake by 43 countries (by the IEA) and you know what? Queensland is rocking.
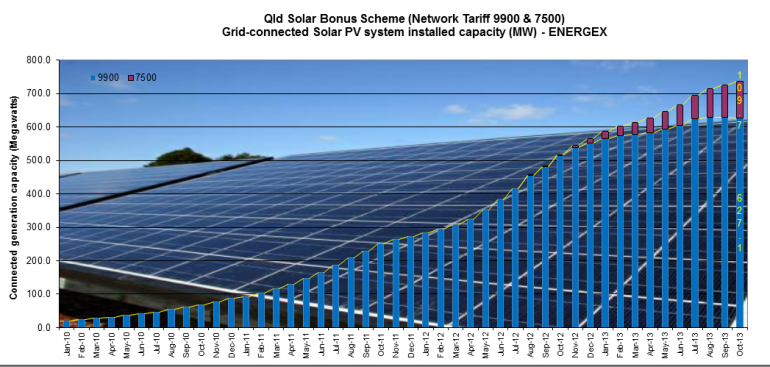
Turns out, our little state of Queensland is on the cusp of the top 20 list of installed cumulative capacity around the world. By the end of the year the sunshine state is set to have around 770MW of PV systems installed, the vast majority on residential rooftops, which makes it number 21 on the list of countries with PV installed.
Of the countries listed by the IEA, that gives Queensland more installed PV generation capacity than 22 other nations including South Africa, Mexico, Malaysia the Netherlands, Israel, Taiwan and more than the entire rest of the Asia Pacific region. Stand up and take a bow Queensland.
In terms of the state’s energy mix, according to AEMO data, today there is 6867MW of scheduled demand in that state, so PV is equal to just under 11 per cent of the entire states demand. Intriguingly, there is 9494MW of scheduled generation capacity available leaving an excess of 2627MW or almost 28 per cent, which is why you won't hear much celebrating from anyone in the electricity industry. It’s tricky.
Their cup clearly runneth over with a confounding mix of frothy, green electrons and a big wad of black coal sludge at the bottom.
Nonetheless, being excitable PV folks let's celebrate the half full glass and look at some of the latest statistics from last months installation rates, courtesy of Energex.
– 688,163,385 kWh fed in: The amount of energy fed into the network from rooftop solar and, therefore, the value of the feed-in tariff paid, has again set a new record of $20.53 million for the premium feed-in tariff, and $529,000 for the 8c tariff. That’s 688,163,385 kWh feed in-on the 44c tariff. The ratio of energy fed into the grid from residential solar to domestic T11 consumption is more than 11 per cent for this month.
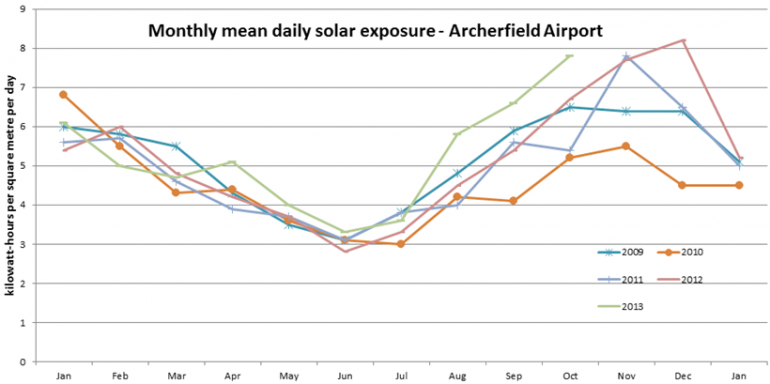
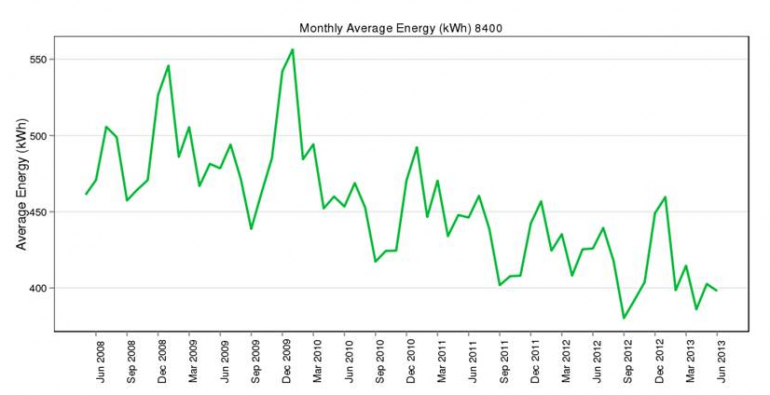
– Above average insulation, below average consumption – why? Traditionally, the September read quarter (Jul-Aug-Sept) is a high feed-in period, where longer days and lower household energy usage coincide (see graphs below). From the BOM data , the average solar radiation per month has been around 13 per cent above average over the past two months. Over the same period, household energy consumption is generally around 5-10 per cent down on the annual average.

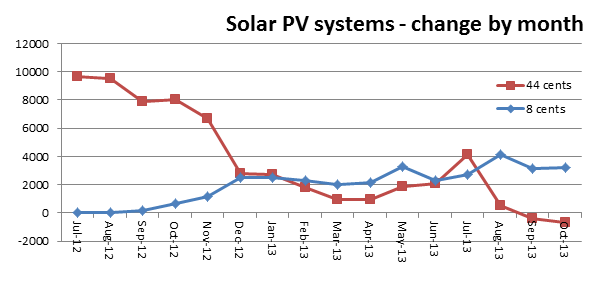
– Ups and downs: By the numbers, Energex now has almost 240,000 solar PV installations in our area – that’s a net increase of 2578 systems in the month. And 930 of these are large installations or connected by large customers (up 43). Of the feed-in tariff qualified systems, there are 205,996 on premium 44 cents – that’s down by 676. Sixty-one new systems were connected (the last of them now?) and 737 reverted to 8 cent or zero as the house is sold.

– 8c connections rising: The number of 8c systems increased by 3215 to 32,202. The number of new systems coming on has been fairly constant around 2300-3200 for a number of months now, with an average inverter capacity of 3.2kW. Over 13 per cent of rooftop systems in SEQ are on 8c tariff now.
– 11.1 per cent of residential energy demand met by PV, total installed inverter capacity now 742 megawatts (10 times that of North Carolina). Energy generated into the network (i.e. excludes self-consumption) was 52,325 GWh. That’s a ratio of 11.1 per cent compared with the NT 8400 (tariff 11) energy consumed from the network over the same period

– Steady as she goes: Our lead measure of new applications remains steady around 3400 per month. Other than the ‘wave’ of late applications in May/June of this year, has remained steady since January.
– And for this month’s weird fact: Over the last two years, the energy generated per system has increased from 73 kWh/month to 217 kWh/month. Global warming? Cheaper bigger systems? Oversizing panels?

Image: Electrical Sensations, Toowoomba, Queensland
Nigel Morris is director of SolarBusinessServices.


