Predictable market chaos ahead


The past week's stockmarket volatility, and its decline over the past month, has reminded us that many of the market's greatest falls have occurred in October. There was the Great Crash of October 28-29 in 1929, when the market fell 13 per cent and 12 per cent on consecutive days; October 19 for the 1987 crash (at 23 per cent still the biggest one-day fall in the market's history); and October 15 2008, when it fell a comparatively piddling 8 per cent, but coincided with the biggest economic downturn since the Great Depression.
Is October the market's ‘witching month'?
It's certainly possible. Of the 20 biggest falls on the Dow Jones -- from the minnow at 6.98 per cent to the Big One at 22.61 per cent --nine of them have happened in October. But partly that's due to clustering: of those 9 Octobers, 6 occurred in those fateful years of 1929, 1987, and 2008. And clustering is the hallmark of a chaotic process, one in which today's change depends on historical data in a complex way, and periods of apparent tranquility are disturbed by movements that can lie far outside the norm.
This is the opposite of the model that mainstream economic theory peddled, and for which Eugene Fama was awarded the Nobel Prize only last year.
Fama and the ‘efficient markets hypothesis' he championed saw movements in the stockmarket as unpredictable in the same sense that a coin toss was unpredictable: because the past history of a coin's toss had no impact on whether the next toss would reveal a head or a tail.
The main paper for which he received the Nobel was published in 1969, and used data 1950 till 1966, and in that period the market made did a passable mimic of a random process. But now we have 65 years of data, and the contrast between what the market actually does and what a ‘random walk' predicts couldn't be starker.
The average daily movement in the S&P500 since 1950 was 0.034 per cent, with a standard deviation of 0.969 per cent. Figure 1 shows what the market would have looked like if those were the only two pieces of information you needed to know, which is what the efficient markets hypothesis asserts.
Figure 1: What stock market data would look like if movements were truly random
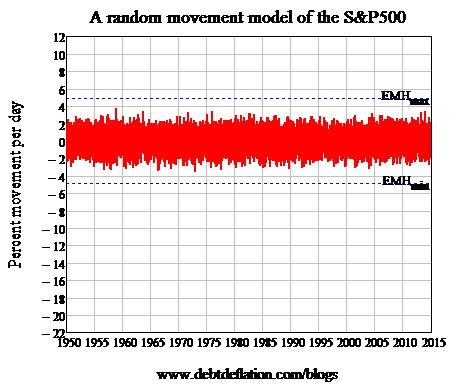
Notice the two blue lines marked EMHmax and EMHmin? They mark plus and minus five standard deviations from the mean: a level of change that should only happen about once every million trading days (roughly therefore once every two and a half millennia). So that's the model.
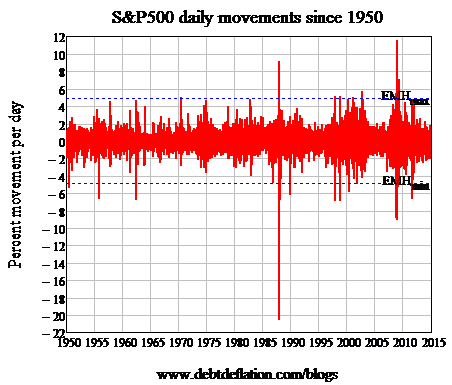
What does the actual data look like? Have a gander at Figure 2. Not only are there about 20 movements that clearly fall well outside the “once every 2500 years” prediction, there are at least five that are more than 8 standard deviations from the mean -- events that, if they were truly random, would only happen once every 700 billion years.
Figure 2: The actual movements of the S&P500
Notice also though that, as well as having many movements that are well outside the ‘impossible' range for a random process, the market's average movement each day is much smaller than the random model predicts. The 16,303 daily data points in Figure 1 have mean of just above zero and a standard deviation of just below 1 per cent, but plus and minus 2 per cent movements are still so common that the graph completely obscures the 2 per cent and -2 per cent gridlines.
Not so for the actual data in Figure 2. There are so many events that lie well within even 1 standard deviation that the 2 per cent and -2 per cent gridlines are clearly visible on the chart. So the actual market tends to have many ‘mild' days, which we can grow accustomed to and treat as the norm. And then a big movement occurs and scares the bejesus out of us.
So in one sense the recent volatility isn't news. It's just the truly non-random, chaotic nature of the market biting us on the bum for our complacency in expecting that a period of tranquil growth in the market could go on forever.
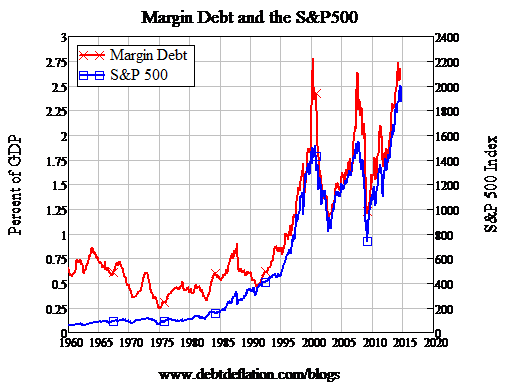
So will this October turn out to be another of the stockmarket's witching months? Here it comes down to what causes the volatility, and on that front the best guide is something that conventional economics assures you that you can safely ignore: the level of leverage in the market. As well as the S&P being in record territory, the level of margin debt has now reached roughly the same peaks that coincided with the 2000 and 2008 market crashes.
Figure 3: Margin debt on the NYSE and the S&P 500
Clearly there's plenty of witch's brew available to fuel market volatility on the downside.


