Power networks ignoring solar and energy efficiency - AEMO
Tuesday night with little fanfare the Australian Energy Market Operator released its forecasts for electricity peak demand by each individual transmission node connection point across Victoria.
‘Yawn’, I hear you say.
It might seem an incredibly technical and uninteresting development, but it represents a major step forward in keeping the power network companies honest. It should hopefully ensure we don’t repeat the incredible hikes in network charges that drove up power bills over the last five years.
For a couple of years now AEMO has been providing its own forecasts of system-wide peak demand for each entire state. But not every distribution network node necessarily peaks at the same time. Households' demand tends to peak at different times to commercial premises and industrial plants. Also some regions will experience different levels of population growth and business activity growth. So just because the overall state-wide peak demand may not be growing, doesn’t mean networks can’t find reasons to argue they need to be expanding the capacity of sections of their networks and grow their charges.
So what does AEMO find?
Well, firstly it suggests the network businesses are still inflating their forecasts of the amount of power capacity we need and therefore are growing their charges above what’s justified.
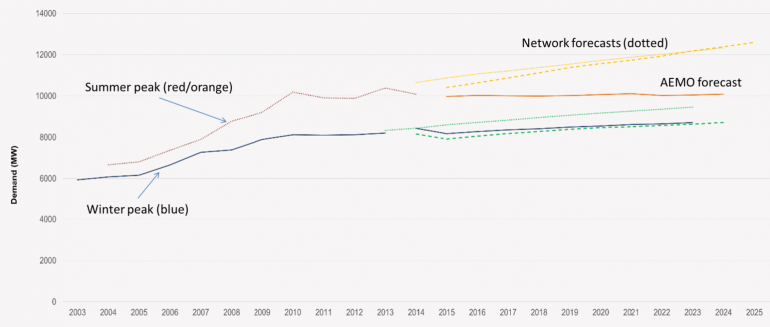
The chart below illustrates actual winter and summer power demand peaks up to 2013 and 2014 with summer being the important one because it’s higher. As Climate Spectator has covered in extensive detail, demand has flatlined since around 2009 in spite of some record hot summers.
AEMO believes peak demand in Victoria will flatline into the future (the solid orange line from 2015). Meanwhile, the network businesses (dotted, lighter orange lines) expect demand growth to recover to levels similar to the period prior to 2009. The accumulated discrepancy over the next decade is huge – more than 2000 megawatts. This works out to something like $400 million per annum of additional network charges consumers would have to pay (based on network capacity cost estimates from an Ernst & Young analysis undertaken for Australian Energy Market Commission).
Figure 1: Aggregated Victorian electricity transmission connection point peak demand for summer and winter - actuals and AEMO vs network businesses’ forecasts.

One of the interesting things that is revealed in AEMO’s report for Victoria, as well as an earlier one prepared for NSW and Tasmania, is that only two of the 11 network businesses explicitly analyse the likely effect on demand of energy efficiency developments via policy and technology. According to AEMO, the remaining nine businesses believe “energy efficiency savings are inherent in the historical data and need not be accounted for explicitly”. In addition, seven of them still don’t take into account any impact on peak demand from growth of solar PV.
This is quite extraordinary.
Government policy efforts to improve energy efficiency stepped-up considerably in Australia between 2006 to 2009. Incandescent light globes were banned, refrigerator standards were upgraded, housing energy efficiency standards were significantly lifted, and standards were introduced for a range of other equipment such as commercial lighting and air conditioners. Also, Victoria instituted a mandated target for energy efficiency savings in 2009.
In addition international efforts (which are relevant because we import almost all energy-consuming appliances and equipment) also stepped-up around this time as well. For example the US energy efficiency regulatory standards program was awoken from its George W. Bush deep freeze with the election of Barack Obama.
Energy analyst Hugh Saddler found that the energy efficiency improvements mainly tied to regulatory interventions explained 37 per cent of the significant drop away in electricity consumption growth between 2010 and 2013 compared to historical growth rates. No doubt it also played an important part in moderating peak demand growth as well.
What’s more households and businesses received a massive price shock in the last few years which has made them more conscious and motivated about improving energy efficiency.
Also, solar PV installations across NSW and Victoria are presently running at around 300 megawatts per year. While not all of this capacity will operate during network peak periods, it seems odd that a majority of network businesses consider it to be irrelevant to their planning.
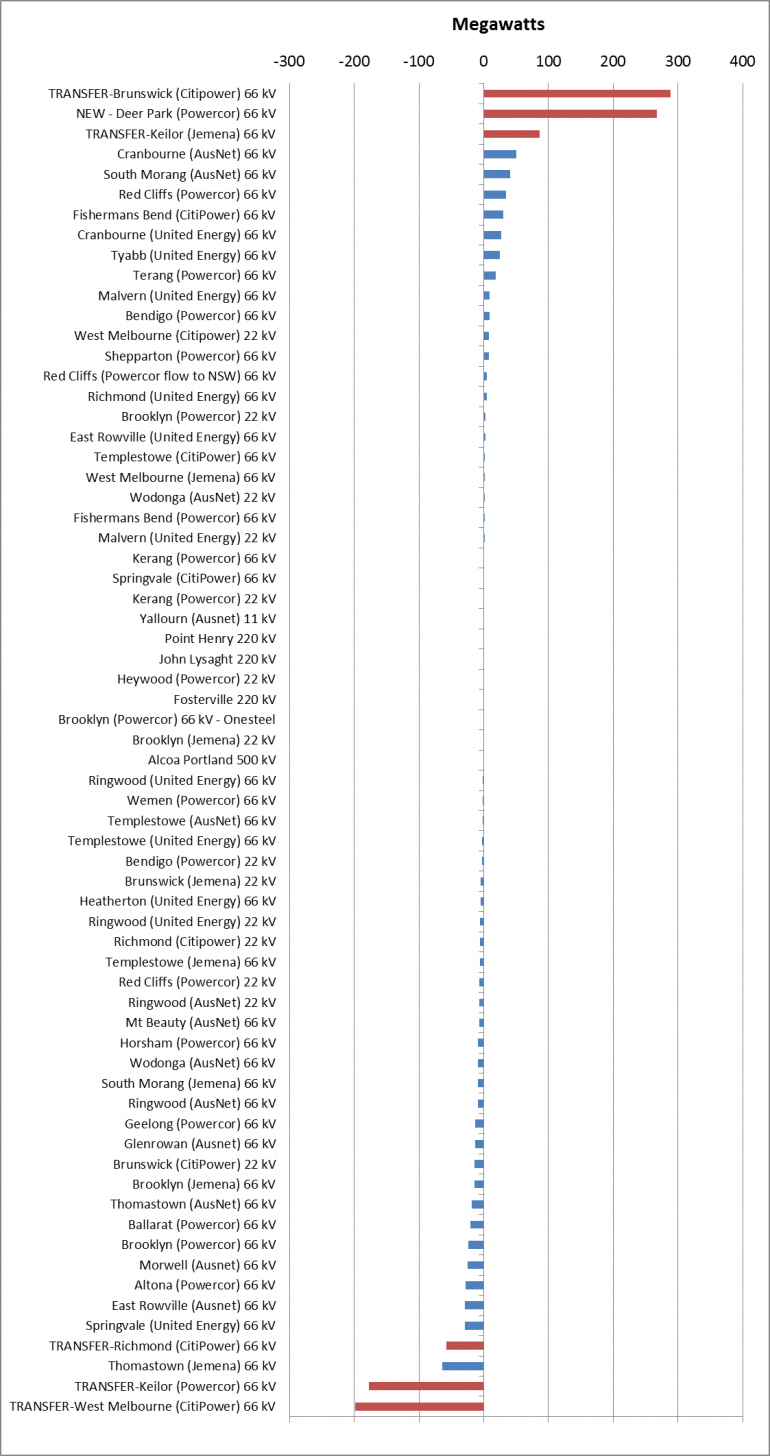
When we delve deeper into the Victorian data it looks as though there is very little bright news for the network companies, such as Ausnet Services and Spark Infrastructure, to grow their asset bases. The chart below details the change in summer peak demand by connection point for the next 10 years. If we exclude the shuffling of demand from one connection point to another (shown by the red bars), only 12 of the 66 connections points are expected to record peak demand growth greater than 5 MW. Across all the connection points where peak demand is expected to increase, the growth in capacity over the next 10 years is just 285 MW, or just 1.5 per cent of total network capacity of 18,840 MW. Meanwhile, peak demand across all the other connection points is expected to decline by 384 MW.
This is an incredible turnaround from just a few years ago when peak demand growth was seen as a major bogeyman.
Figure 2: Change in summer peak demand by Victorian connection point – 2015 vs 2024 (MW)


