Our Income Portfolio on target


Summary: With a lacklustre reporting season behind us, the Income First model portfolio has performed well under soft market conditions. The portfolio declined 2.84 per cent in the March quarter – just under the All Ordinaries Accumulation Index over the same period, as the banks offset strong performances from the likes of Steadfast and Arena REIT. |
Key take-out: The portfolio has taken some time to take shape and become fully invested – over the coming months we expect to lift our invested capital investments above 90 per cent. The portfolio is currently hitting its targets as we consider future opportunities down the line. |
Key beneficiaries: General investors. Category: Shares. |
The March quarter has been undoubtedly soft for the Australian equities market, driven largely by significant weakness in the large caps space. Banks, miners and so-called blue chip large caps have been sold down since the beginning of 2016 through what can be described as a lacklustre February reporting season. Here are some key performance measures for major indices over the quarter:
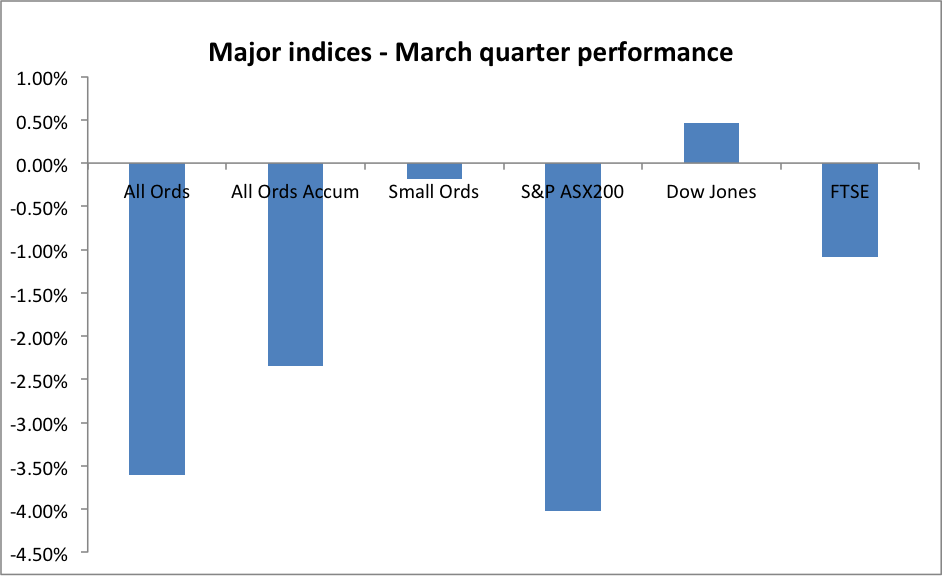
As can be seen, the market has been quite soft, with the best of a bad bunch being the Small Ordinaries and the US market. This has created a challenging environment for investors. However, I would contend that the recent lacklustre performance at the large end of the market is likely a sign of things to come, and an opportunity for active and discerning investors to add value and performance through stock selection.
Income First model performance
During the quarter the Income First model portfolio declined 2.84 per cent, marginally underperforming the portfolio benchmark - the All Ordinaries Accumulation index (which was down 2.35 per cent over the same period). The portfolio value had hit a high at the end of last year with a small profit showing. However, underperformance in the banks, as well as Automotive Holdings Group (AHG) and Tatts (TTS) has offset strong performances from Steadfast (SDF), Arena REIT (ARF) and G8 Education (GEM). Here is the individual stock performance for the portfolio over the course of the quarter:
Code | Dec 31 price | March 31 price | Dividend accrued | return (ex-franking) |
AHG | $ 4.52 | $ 4.09 | $ 0.10 | -7.41% |
ANZ | $ 27.93 | $ 23.46 | $ - | -16.00% |
NAB | $ 29.14 | $ 26.24 | $ - | -9.95% |
FXL | $ 3.02 | $ 2.48 | $ 0.07 | -15.48% |
SDF | $ 1.56 | $ 1.79 | $ 0.02 | 16.28% |
VRT | $ 6.50 | $ 6.26 | $ 0.14 | -1.54% |
WLL | $ 5.32 | $ 4.98 | $ 0.09 | -4.70% |
GEM | $ 3.57 | $ 3.77 | $ 0.06 | 7.28% |
DWS | $ 1.14 | $ 1.12 | $ 0.05 | 2.41% |
ARF | $ 1.78 | $ 1.98 | $ 0.03 | 12.79% |
TTS | $ 4.39 | $ 3.78 | $ 0.10 | -11.73% |
Portfolio yield
The March quarter is an important one for Australian equities income investors. The majority of businesses report financial result in February and announce with those results the dividend payable. Additionally, most commence trading on an ex-dividend basis, so a good line of sight is provided on the yield of the portfolio. Based upon this it is worthwhile looking at the forecast yield of the stocks currently held in the portfolio, and how that combines to provide an expected portfolio yield for investors in the 12 months ahead. Here is the stock by stock breakdown for expected dividend yield:
Code | Quarter yield | Forecast forward yield | Forward gross yield |
AHG | 2.3 per cent | 5.62 per cent | 8.03 per cent |
ANZ | 0.0 per cent | 7.46 per cent | 10.66 per cent |
NAB | 0.0 per cent | 7.43 per cent | 10.62 per cent |
FXL | 2.9 per cent | 6.05 per cent | 8.64 per cent |
SDF | 1.3 per cent | 3.63 per cent | 5.19 per cent |
VRT | 2.2 per cent | 4.63 per cent | 6.62 per cent |
WLL | 1.8 per cent | 4.42 per cent | 6.31 per cent |
GEM | 1.6 per cent | 6.37 per cent | 9.09 per cent |
DWS | 4.2 per cent | 8.48 per cent | 12.12 per cent |
ARF | 1.4 per cent | 5.56 per cent | 5.56 per cent |
TTS | 2.5 per cent | 4.63 per cent | 6.61 per cent |
CCP | 0 | 4.54 per cent | 6.48 per cent |
Overall, when weights are applied to this, the portfolio's expected yield for the coming 12 months is around 4.1 per cent, or 5.8 per cent including the value of franking credits. This is a healthy return in line with our targets, and is being produced by a portfolio that is holding a conservative 25 per cent weighting in cash, protecting against market downside.
Cash allocation
The portfolio assumes no return on the cash held from the potential for interest accruals, thus the income calculations are likely to be conservative. That said, we are cognisant of the fact that the portfolio is not intending to engage in asset allocation. The intention remains to assess and invest in new opportunities as they arise. Over coming months we expect to lift our invested capital towards more than 90 per cent of the portfolio value.
Summary
The Income First model portfolio is tracking to meet all of its objectives, including an above market gross dividend yield and some capital appreciation over the long term. The portfolio has taken some time to take shape as funds have been deployed slowly over time, meaning that the yield to date has lagged the market. Looking forward, expectations are that the portfolio is now sufficiently invested to meet its income targets, and is invested in businesses with healthy prospects for share price appreciation. No doubt there will be additional opportunities in the near future to further enhance this position.


