No sign of end to falling electricity demand
The following is the latest report on Australia's energy emissions from pitt&sherry.
Total emissions continued to fall and, for the year ended March 2013, were 2.7 million tonnes CO2-e lower than they were in the year ended December 2012 and nearly 9 million tonnes lower than in the previous year, to March 2012.
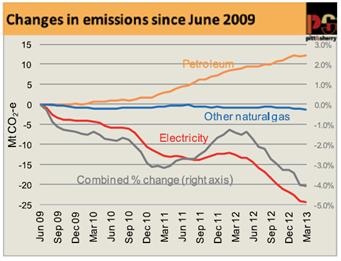
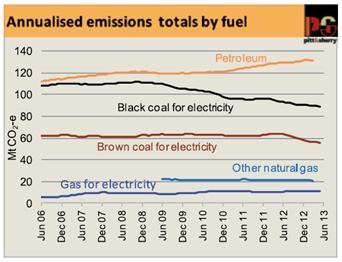
The established pattern of the last three years continued, with falling electricity generation emissions more than offsetting growth in emissions from petroleum fuels, while emissions from non-electricity natural gas use were almost unchanged.
May 2013 was the thirteenth successive month in which annualised emissions reported by Cedex fell. Given the annualisation procedure, this reflects changes in patterns of energy supply and use extending back to mid-2011. The carbon price introduced in July 2012 is therefore not the only driver of reduced emissions, but it has probably helped to reinforce a trend already underway.
It is also not implausible that the high media profile given during 2011 and 2012 to the potential impact of a carbon price caused energy users to pay more attention to how and how much energy they were using and, in doing so, realise opportunities to conserve, or use energy more efficiently.
Petroleum
Ever since Cedex started it has been recording steady growth in consumption of petroleum fuels, and associated emissions, interrupted only by a shallow and short lived slowdown in the first half of 2009. This trend continues, apparently unabated.
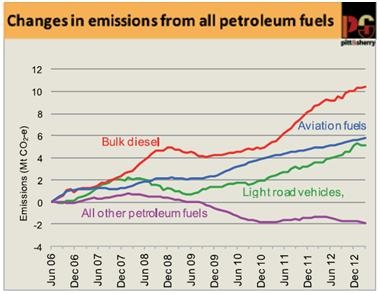
Past Cedex reports have drawn attention to the particularly rapid growth in consumption of bulk diesel fuel (defined as sales not made through retail fuel outlets) and the probable importance of mining activity as a driver of this growth. When changes in bulk diesel sales are viewed on a state by state basis, the likely impact of mining, mining related construction and heavy transport activity is particularly striking. In the two years since March 2011 there has been spectacular growth in diesel consumption in Queensland and WA, and very little growth in any of the other states.
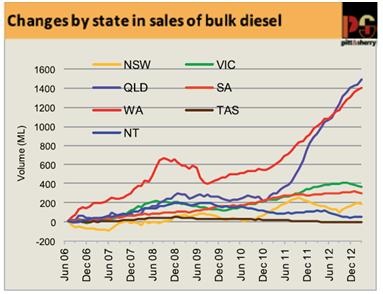
The total increase in consumption in Queensland and WA contributed 5.5 million tonnes CO2-e to Australia’s emissions over those two years. This countered almost half the decrease in emissions from electricity over the same period.
It is likely that some of the steady increase in sales of aviation fuels over the same period was contributed by the increase in domestic flights carrying fly-in fly-out workers to mine construction and operation sites. There can be little doubt that increased international flights have also contributed to the growth in jet fuel consumption (Australian Petroleum Statistics do not distinguish between domestic and international sales of jet fuel).
Changes in sales of light vehicle fuels (defined, in Cedex, as all sales of petrol, automotive LPG and sales of diesel through retail outlets) show a different, but equally interesting pattern, when examined on a state by state basis and taking account of trends in sales of the three constituent components of this category.

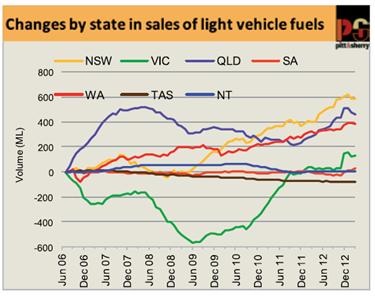
Since late 2010, consumption has increased by 9 per cent in Victoria, 7 per cent in WA, 4 per cent in NSW, 3 per cent in Queensland, and 2 per cent in SA. It has decreased in Tasmania and the NT. As Figure 5 shows, all the increase has been diesel fuel, reflecting a steady shift towards diesel engine cars plus rapid growth in light commercial vehicle travel, as discussed in the previous Cedex report. The resultant increase in emissions over the period has been just under 3 million tonnes CO2-e.
While it is difficult to attribute causes of changes over time and differences between the states, it is possible that changes in fuel distribution logistics have affected state sales records.
Natural gas
Data on the direct use of natural gas (as opposed to use for electricity generation) have only been available since 2008, meaning that currently there are just under four years of annual data. Consumption has been falling slowly but steadily for seven months up to March this year, when it was at its lowest level since data became available. It is likely that higher retail gas prices have been an important driver for increased gas use efficiency. Additionally some industrial gas users have slowed or ceased manufacturing activity, along with their gas use.
National Electricity Market update to May
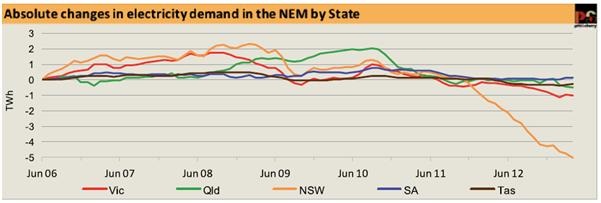
In May, total NEM demand fell by a further 0.6 TWh (equivalent to 0.3 per cent), driven almost entirely by a reduction in NSW, attributable to the closure of the Kurri Kurri aluminium smelter last September.
This closure reduced annual demand by about 3.5 TWh, which will show up in the month by month annualised figures as a reduction of 0.3 TWh per month in each month up to next September.
The reduced demand was exceeded by reduced output from both black and brown coal generators, and also a small reduction from gas generators, while output from large hydro and from wind and other renewable both increased.
As a consequence of this changing supply mix, the average emissions intensity of NEM generation fell for the fifteenth successive month.
Most of the fall in annual black coal generation occurred in Queensland, with NSW generation virtually unchanged from April. In NSW, the Wallerawang unit which had been shut down in late summer was brought back online in early May, but Unit 4 at Liddell remained off line for the whole month. In Queensland, two of the four units at Tarong remained off line for the whole of May, as they had been since late last year.
The increase in hydro generation came from Tasmania and from the Victorian (Murray) side of the Snowy. For the year ended May 2013, total hydro generation was 9.2 per cent of NEM generation, the highest share since Tasmania joined the NEM in 2005. The share of hydro in mainland NEM generation reached its highest level since 2001. In addition, wind and other intermittent generation reached its highest ever share of annual NEM generation, at 4.0 per cent.
The Victorian market is important in the changing patterns of generation. While exports to NSW and South Australia are currently accounting for about 10 per cent of total brown coal generation (about 9 per cent of total state demand), imports of hydro electricity from Tasmania are about 5 per cent and growing on an annualised basis. As noted in previous Cedex Electricity Updates, rainfall and politics will determine for how long Tasmania can continue to profit in the NEM from its exports of zero emission electricity.
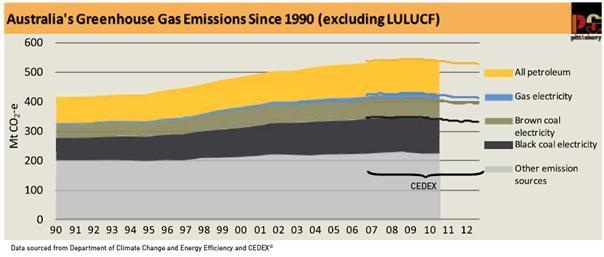
The Energy Sector is the largest source of Australia’s greenhouse gas emissions. The energy use covered by the
Cedex accounts for about 80 per cent of Australia’s total energy combustion emissions, and 54 per cent of total emissions (excluding land use change and forestry), as reported in the National Greenhouse Gas Inventory. Figure 8 below illustrates the growth in energy sector emissions, with the lines at the right showing the period and emission sources covered in the Cedex.
Increases in energy combustion have caused more than 90 per cent of the increase in total emissions since 1990. Trends in energy emissions are a reliable indicator of Australia’s ability to achieve emissions mitigation and hold the key to reducing emissions as a whole.


