Listed debt finds a weaker patch


Summary: The resumption of primary issuance for the year has seen a weaker performance from the Australia Ratings family of indices, down 1.71 per cent on an annualised basis. |
Key take-out: With three issues announced in February, with known investor demand sitting at $2.6bn and likely to go higher before these issues commence trading, 2017 could be big year for the debt security market. |
Key beneficiaries: General investors. Category: Fixed interest. |
This is the latest article on this subject and follows on from Debt securities deliver strong 2016 returns (January 27) and How to find value in the listed debt market (February 3).
February saw a change in secondary market conditions for ASX-listed debt securities. In other words, prices have fallen for some securities relative to where they were at the end of January.
The reason for the decline is the resumption of primary issuance for the year. And with three issues announced in February, with known investor demand sitting at $2.6 billion and likely to go higher before these issues commence trading, 2017 could be big year, unless the volume already coming to the market quickly sates investors' appetites.
Not surprisingly, with $1.8bn of the known new supply poised to enter Australia Ratings' Red index – namely, hybrid securities issued by financial institutions – this index declined over the month by 0.14 per cent, or 1.71 per cent on an annualised basis.
However, it should be remembered that the Australia Ratings' family of ASX-listed debt securities indices are accumulation indices. If the indices were simple price indices, the fall in the Red index would have been more than twice as large, at 0.38 per cent.
And while the constituents of the Red index form the largest group in the Combined index, it was distributions declared during the month by members of the other indices that prevented a decline in the Combined index. The Combined index increased by just 0.05 per cent over February.
The best performance was again seen in the low risk Green index for senior ranking bonds. The index increased by 1.25 per cent, or 16.12 per cent on an annualised basis.
This strong performance is attributable to strong price growth in the Australian Unity simple corporate bonds (AYUHB), which had gone ex-distribution in January. The price of the securities jumped to $105.10, after ending January at $103.45.
Similar price performance was seen from the Tattersalls (TTSHA) bonds. At the end of December the bonds appeared very expensive on a relative value basis and thus the price eased in January, but after ending the month at $103.08, the price at the end of February had jumped to $104.50.
The Yellow index – which covers securities with deferrable but cumulative distributions – also performed well, increasing by 1.06 per cent over the month. Continuing increases in the price of the Crown Resorts subordinated notes, CWNHA and CWNHB, and the latter in particular, are the cause.
The Orange index – securities with deferrable, non-cumulative distributions – also increased over the month but by a more modest 0.71 per cent. Distributions declared during the month made a significant contribution to the increase in the index.
Chart 1: Performance of the Australia Ratings indices excluding the Unfranked and Franked indices
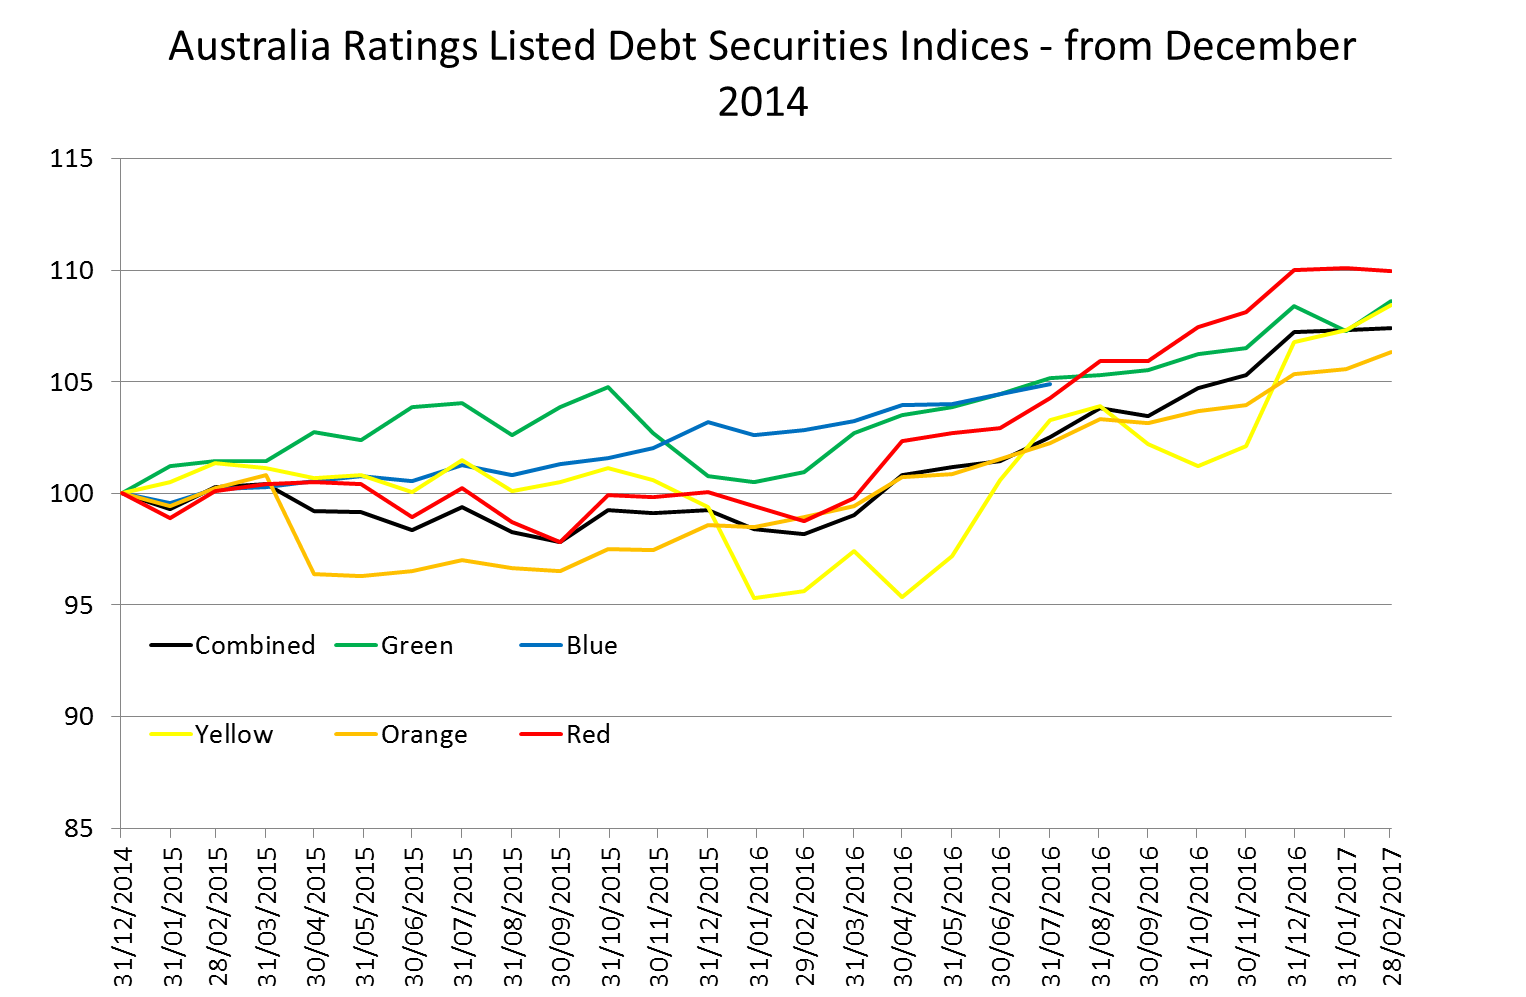
Source: ADCM Services, Ord Minnett
The weakness in the Red index is reflected in the Franked index, which includes many of the same constituents. The Red index increased by only 0.03 per cent over the month.
The Unfranked index performed better, increasing by 0.99 per cent.
Chart 2: Performance of the Australia Ratings Unfranked and Franked indices
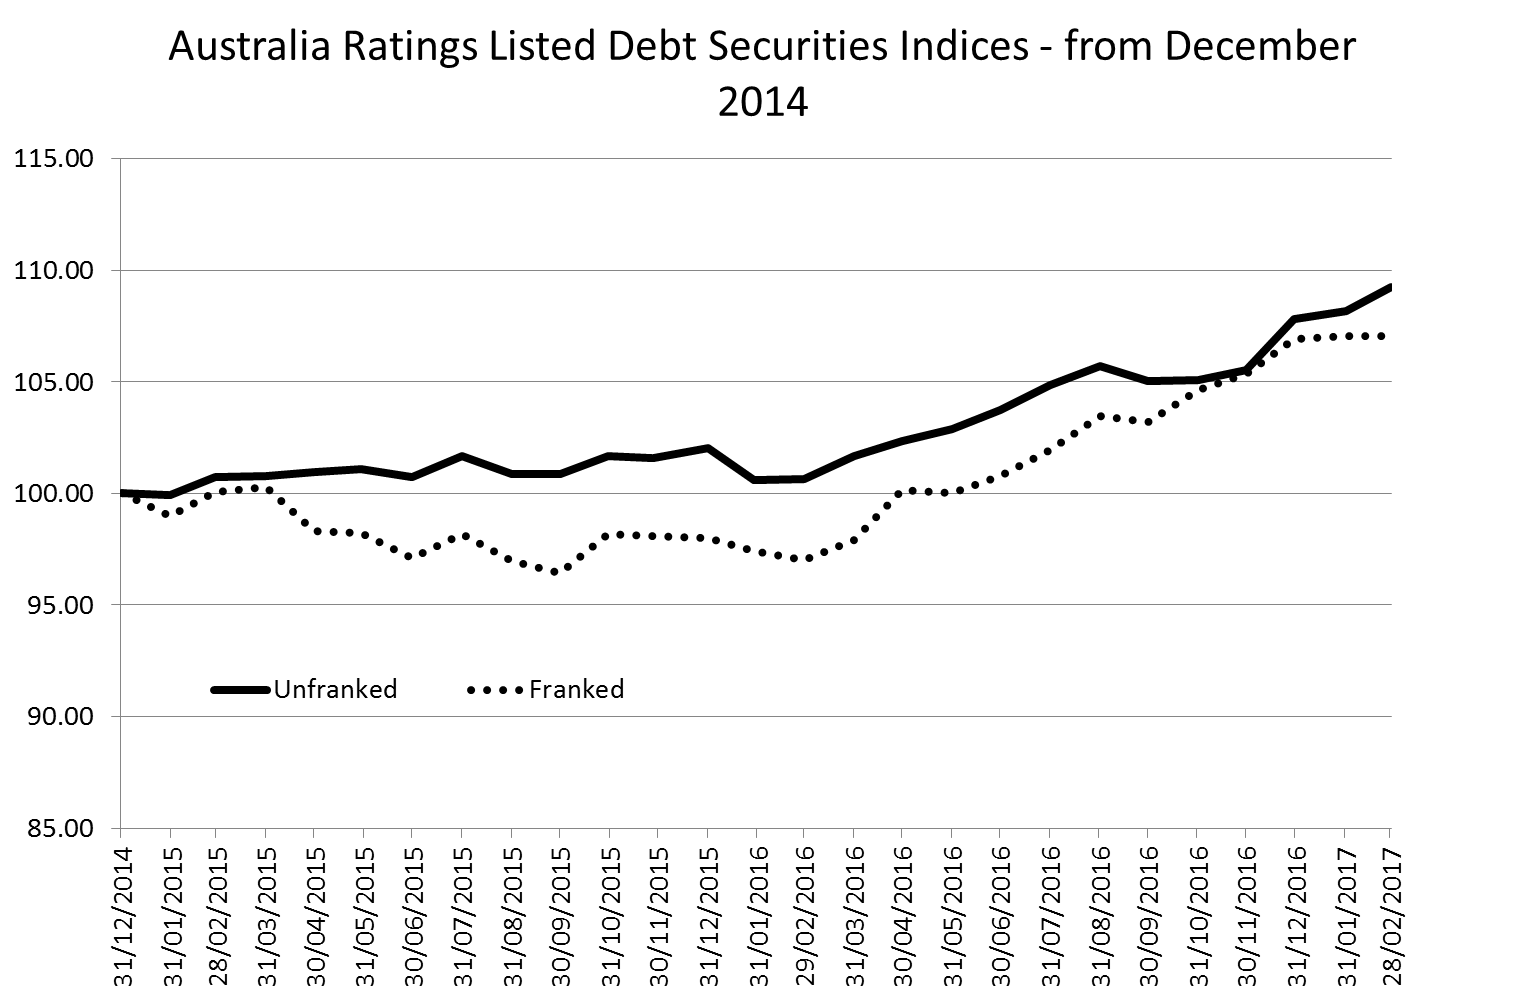
Source: ADCM Services, Ord Minnett
The weighted average yield of each of the indices tells the story about price movements, as yields move inversely to prices, and this removes the impact of distributions on the accumulation indices.
The weighted average yield of the Red index reached a low of 5.84 per cent per annum at the end of 2016. The yield increased by 2 basis points in January but by the end of February it had jumped to 6.04 per cent, clearly showing the impact of the new supply coming into this index.
This again shows up in the weighted average yield of the Combined index, which increased to 5.7 per cent at the end of February, up from 5.63 per cent at the end of January. The Green, Yellow and Orange indices experienced further contractions in weighted average yields to 3.90 per cent, 5.90 per cent and 3.71 per cent per annum, respectively.
The apparent discrepancy in the weighted average yields of the three indices is due to the idiosyncratic characteristics of individual issuers in the indices.
Chart 3: Movement in Weighted Average Yields by index from December 2014
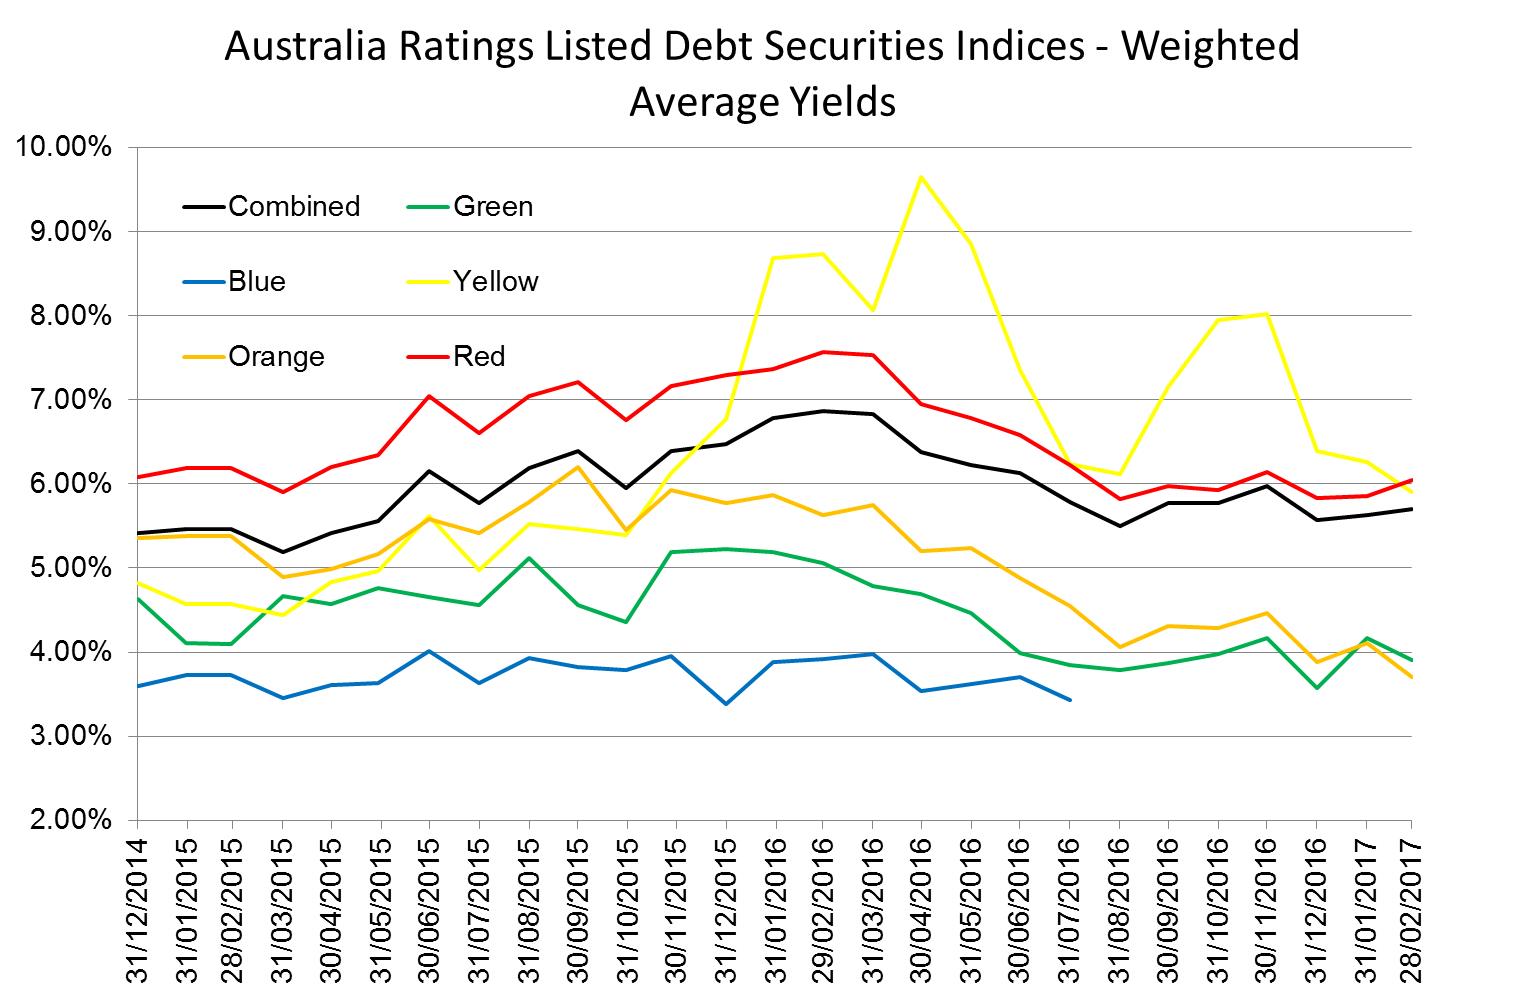
Source: ADCM Services, Ord Minnett
Value may be found in securities other than hybrids
The softness that has emerged in the prices of some ASX-listed debt securities over the last month invites consideration of relative value in the secondary market. Applying our proprietary multi-factor regression model reveals that the model can explain more than 85 per cent of the variation in yield to call among the securities included in the Australia Ratings ASX-listed debt securities indices.
Thus, it is the 15 per cent of variation that is of interest – the outliers in the group – those that are well above or below the fair value line, as shown in Chart 4. Being positioned above the fair value line suggests the security is cheap relative to others, and vice-versa for those positioned below the line.
Chart 4: Actual yield to call relative to the fair value line
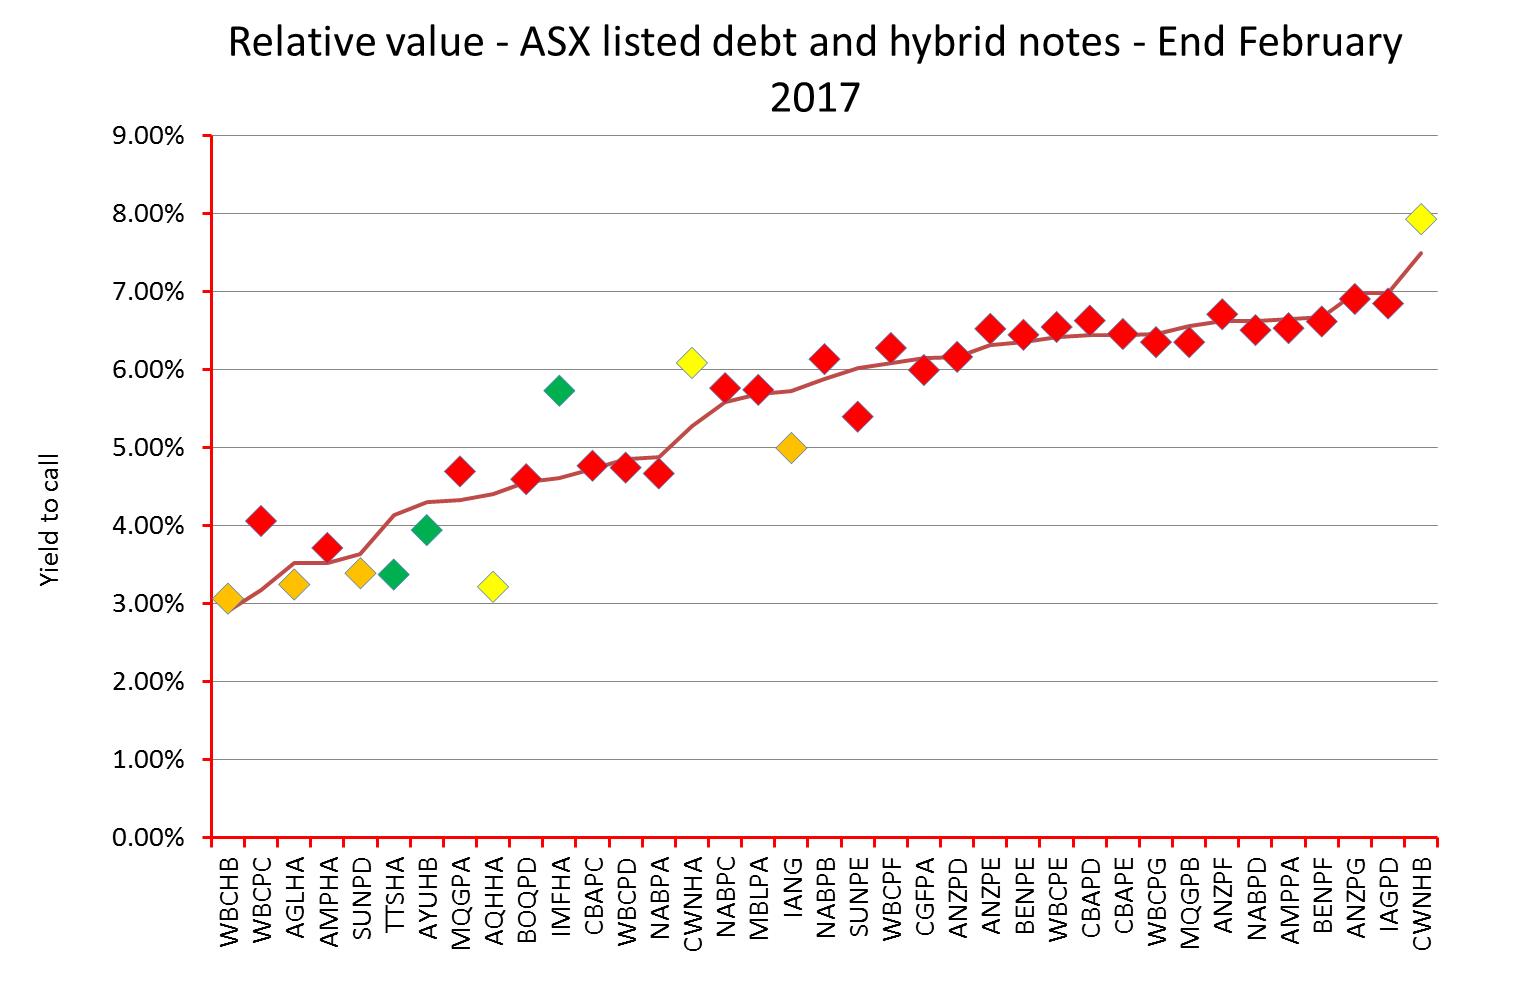
Source: ADCM Services
Two observations can be made from Chart 4.
The first is that the market appears to be very efficient in pricing those securities that are the constituents of Australia Ratings' Red index (which covers hybrids, generally released by financial institutions). There is much more variation among the constituents of the other indices.
The second observation is that most of the variation in the yield to call relative to fair value appears toward the left hand side of the chart. Somewhat coincidentally, this generally aligns with a shorter period of time until the call date is reached.
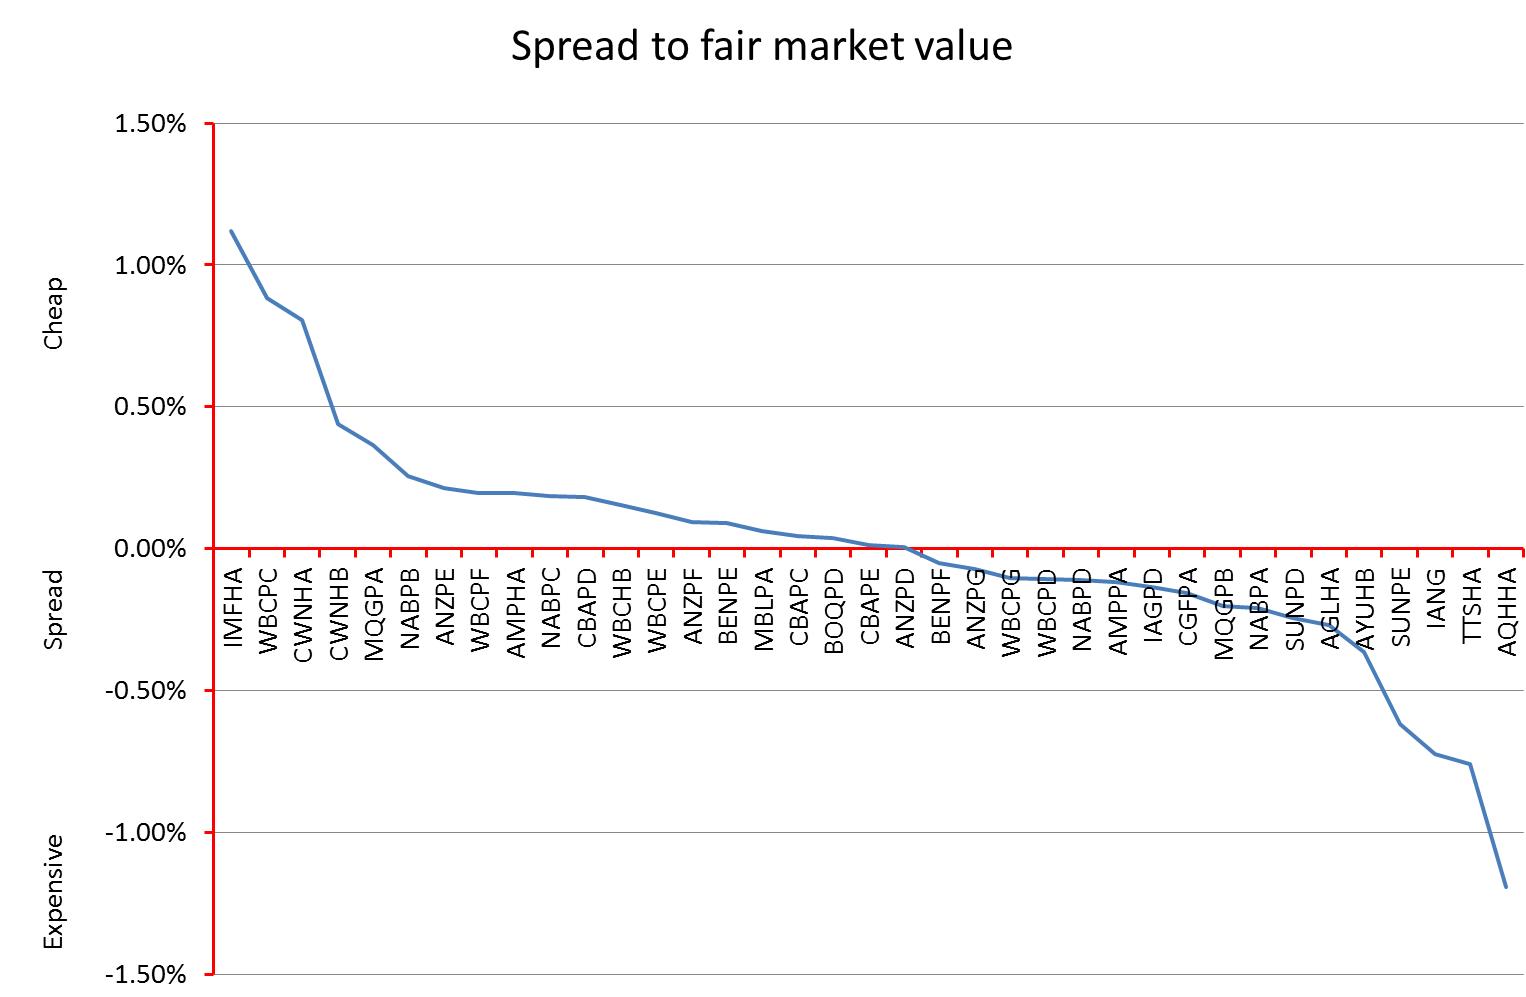
Chart 5 makes relative value among the securities very clear. The securities are ranked from cheapest to most expensive, as estimated by the model.
But remember this is a purely quantitative ranking with no qualitative factors taken into account. No investment or divestment decisions should be made without due consideration of the qualitative factors that could be impacting the market's assessment of individual securities.
Chart 5: A ranking from cheapest to most expensive, as at February 28
Source: ADCM Services
Dr Philip Bayley is a former director of Standard & Poor's and now works as an independent consultant to debt capital market participants. He is associated with Australia Ratings.


