InvestSMART Portfolio Update - September 2017


The Core Growth Portfolio also benefited from the strong performance. Made up of over 1,200 individual securities and with investments in every day names such as Nestle, Roche, HSBC & Unilever, VEQ forms the core of our diversified European Equities exposure.
|
Ticker |
VEQ |
|
Management Cost |
0.35% pa |
|
Market Cap |
$117m |
|
Inception |
Dec 2015 |
|
Benchmark |
FTSE Developed Europe All Cap Index |
|
Domiciled |
Australia |
Figure 1: Key Features, VEQ
Source: Vanguard
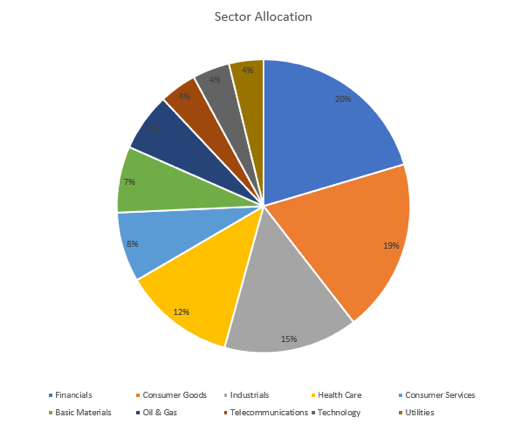
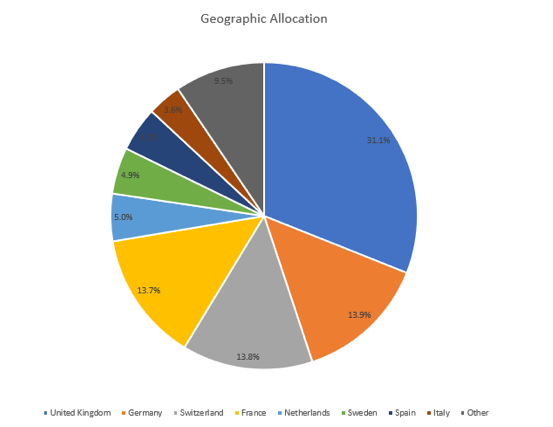
Figure 2: VEQ Sector & Geographic Allocations as at 31 August 2017
Source: Vanguard
The Hybrid Income Portfolio also saw relatively a strong return as a large number of portfolio names went ex-distribution during the month and the franking credits attached to these distributions adding just over 40bp to returns.
The Interest Income & Diversified Property & Infrastructure Portfolios saw flat to slightly negative returns for the month, however improvements in the margin between the portfolios and their respective benchmarks over the longer term is positive and in line with our objective.
InvestSMART Interest Income Portfolio
Overview
The InvestSMART Interest Income Portfolio produced a return of 0.01% (after fees) during September.
The Macquarie Income Opportunities Fund (MAQ0277AU) was the best performing security for the month up 0.4% while the iShares Core Composite Bond ETF (IAF) was worst performing at -0.2%.
The estimated yield on the portfolio is currently 2.30%.
Since inception, the portfolio has returned 2.06% per annum (after fees).
Performance
|
Performance to 30 September 2017 |
1 Month |
3 Months |
6 Months |
1 Year |
SI (p.a) |
|
InvestSMART Interest Income |
0.01% |
0.16% |
0.91% |
0.16% |
2.06% |
|
Bloomberg AusBond Composite 0 Y TR AUD |
-0.31% |
-0.07% |
0.94% |
-0.75% |
2.86% |
|
Excess to Benchmark |
0.32% |
0.23% |
-0.03% |
0.91% |
-0.80% |
Figure 3: Portfolio Performance after fees
Source: InvestSMART
InvestSMART Core Growth Portfolio
Overview
The InvestSMART Core Growth Portfolio produced a return of 0.72% (after fees) during September.
The Vanguard FTSE Europe Shares ETF (VEQ) was the best performing security for the month up 4.3% while the VanEck Vectors FTSE Global Infrastructure (Hedged) ETF (IFRA) was worst performing at -1.7%.
The estimated yield on the portfolio is currently 2.90%.
Since inception, the portfolio has returned 7.06% per annum (after fees).
Performance
|
Performance to 30 September 2017 |
1 Month |
3 Months |
6 Months |
1 Year |
2 Years |
SI (p.a) |
|
InvestSMART Core Growth |
0.72% |
0.97% |
1.83% |
8.16% |
7.19% |
7.06% |
|
Morningstar Aus Msec Growth TR AUD |
1.05% |
1.32% |
2.05% |
7.26% |
7.56% |
7.79% |
|
Excess to Benchmark |
-0.33% |
-0.35% |
-0.22% |
0.90% |
-0.37% |
-0.73% |
|
RBA Cash Rate 3% |
0.37% |
1.13% |
2.27% |
4.59% |
4.78% |
4.96% |
|
Excess to Objective |
0.35% |
-0.16% |
-0.44% |
3.56% |
2.40% |
2.10% |
Figure 4: Portfolio Performance after fees
Source: InvestSMART
InvestSMART Diversified Income Portfolio
Overview
The InvestSMART Diversified Income Portfolio produced a return of -0.03% (after fees) during September.
The Vanguard Australian Property Securities Index ETF (VAP) was the best performing security for the month up 0.4% while the iShares Core Composite Bond ETF (IAF) was worst performing at -0.2%.
The estimated yield on the portfolio is currently 3.30%.
Since inception, the portfolio has returned 3.96% per annum (after fees).
Performance
|
Performance to 30 September 2017 |
1 Month |
3 Months |
6 Months |
1 Year |
2 Years |
SI (p.a) |
|
InvestSMART Diversified Income |
-0.03% |
0.32% |
-0.21% |
2.32% |
5.11% |
3.96% |
|
Morningstar Aus Msec Moderate TR AUD |
0.35% |
0.77% |
1.55% |
3.13% |
4.79% |
4.57% |
|
Excess to Benchmark |
-0.37% |
-0.45% |
-1.76% |
-0.82% |
0.32% |
-0.61% |
|
RBA Cash Rate 1% |
0.21% |
0.63% |
1.26% |
2.53% |
2.71% |
2.84% |
|
Excess to Objective |
-0.24% |
-0.31% |
-1.47% |
-0.21% |
2.40% |
1.12% |
Figure 5: Portfolio Performance after fees
Source: InvestSMART
InvestSMART Diversified Property & Infrastructure Portfolio
Overview
The InvestSMART Diversified Property & Infrastructure Portfolio produced a return of -0.12% (after fees) during September.
Westfield Corporation (WFD) was the best performing security for the month up 5.5% while APA Group (APA) was worst performing at -5.7%.
The estimated yield on the portfolio is currently 3.20%.
Since inception, the portfolio has returned 4.08% per annum (after fees).
Performance
|
Performance to 30 September 2017 |
1 Month |
3 Months |
6 Months |
1 Year |
SI (p.a) |
|
InvestSMART Diversified Property & Infrastructure |
-0.12% |
0.11% |
-3.93% |
-5.95% |
4.08% |
|
A Composite Index |
-1.41% |
-0.22% |
-3.62% |
-4.61% |
5.52% |
|
Excess to Benchmark |
1.29% |
0.33% |
-0.31% |
-1.34% |
-1.44% |
Figure 6: Portfolio Performance after fees
Source: InvestSMART
InvestSMART International Equities Portfolio
Overview
The InvestSMART International Equities Portfolio produced a return of 2.71% (after fees) during September.
The Vanguard FTSE Europe Shares ETF (VEQ) was the best performing security for the month up 4.3% while iShares Asia 50 ETF (IAA) was worst performing at 0.7%.
The estimated yield on the portfolio is currently 1.90%.
Since inception, the portfolio has returned 10.65% per annum (after fees).
Performance
|
Performance to 30 September 2017 |
1 Month |
3 Months |
6 Months |
1 Year |
2 Years |
SI (p.a) |
|
InvestSMART International Equities |
2.71% |
2.00% |
6.38% |
14.70% |
7.78% |
10.65% |
|
MSCI World Ex Australia NR AUD |
3.44% |
2.53% |
6.25% |
15.38% |
8.45% |
13.02% |
|
Excess to Benchmark |
-0.73% |
-0.54% |
0.13% |
-0.68% |
-0.67% |
-2.37% |
Figure 7: Portfolio Performance after fees
Source: InvestSMART
InvestSMART Hybrid Income Portfolio
Overview
The InvestSMART Hybrid Income Portfolio produced a return of 0.74% (after fees) during September.
Macquarie Group Capital Notes 2 (MQQPB) was the best performing security for the month up 2.80% while Westpac Capital Notes (WBCPD) was worst performing at -0.2%.
The estimated Gross Running Yield (incl. of franking) is currently 5.1% while the Yield to Maturity (incl. of franking) is 5.2%.
Since inception, the portfolio has returned 1.11% per annum (after fees).
Performance
|
Performance to 30 September 2017 |
1 Month |
3 Months |
SI (p.a) |
|
InvestSMART Hybrid Income |
0.74% |
1.11% |
1.11% |
|
RBA Cash Rate 3% |
0.37% |
1.13% |
1.13% |
|
Excess to Benchmark |
0.36% |
-0.02% |
-0.02% |
Figure 8: Portfolio Performance after fees
Source: InvestSMART


Frequently Asked Questions about this Article…
The InvestSMART Core Growth Portfolio produced a return of 0.72% after fees during September. Since inception, it has returned 7.06% per annum.
The InvestSMART Interest Income Portfolio produced a return of 0.01% after fees in September. Its estimated yield is currently 2.30%, and it has returned 2.06% per annum since inception.
The Vanguard FTSE Europe Shares ETF (VEQ) has a management cost of 0.35% per annum, a market cap of $117 million, and is benchmarked against the FTSE Developed Europe All Cap Index. It is domiciled in Australia.
The Vanguard FTSE Europe Shares ETF (VEQ) was the best performing security in the InvestSMART International Equities Portfolio for September, with a return of 4.3%.
The estimated yield on the InvestSMART Diversified Income Portfolio is currently 3.30%.
The InvestSMART Hybrid Income Portfolio produced a return of 0.74% after fees in September. Its estimated Gross Running Yield, including franking, is 5.1%.
The InvestSMART Diversified Property & Infrastructure Portfolio produced a return of -0.12% after fees in September. Since inception, it has returned 4.08% per annum.
The iShares Core Composite Bond ETF (IAF) was the worst performing security in the InvestSMART Interest Income Portfolio for September, with a return of -0.2%.


