InvestSMART Portfolio Update - October 2017


With the InvestSMART Core Growth and International Equities Portfolios turning three, it is a good opportunity to review our longer-term performance and see how we’ve gone in delivering on our objectives.
Programmatically analysing the asset allocation of over 8,000 managed funds in Australia, provides us with information to actively manage the asset allocation within our portfolios with the objective of delivering returns in line with them, but at a lower cost.
Through the use of ETFs and select individual securities we construct portfolios aimed at providing investors the ability to diversify their portfolios and achieve their long term investment objectives via simple low cost investment solutions.
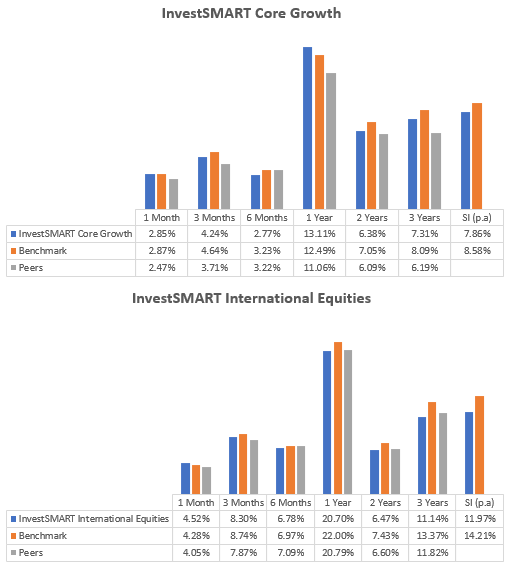
The Core Growth Portfolio forms part of our “diversified” investment offering, with an asset allocation weighted toward generating returns with more of a growth focus.
This sees an asset allocation of roughly 65-75% growth orientated assets (equities & property) and 25-35% income orientated assets (interest income & cash).
It is pleasing to note that over the long term, our strategy is performing in line with stated expectations. That is, we are tracking our benchmark by the difference in our fee while also outperforming our peers.
International Equities
The International Equities Portfolio provides investors exposure to a range of global equity markets at a cost of only 0.77%. This compares well to other actively managed funds, where fees are generally 1.50% or higher plus performance fees.
Again, over the longer term we are performing roughly in line with our peers, however, the margin between the benchmark and our portfolio is slightly wider than we would like. This is the result of an under allocation to the US over the period when compared to our benchmark in favour of aligning closer to the regional allocation of our peer group.
You can find out more about investing directly in InvestSMART portfolios by clicking here.
InvestSMART Core Growth Portfolio
The InvestSMART Core Growth Portfolio produced a return of 2.85% (after fees) during October.
The iShares S&P500 ETF (IVV) was the best performing security for the month up 4.86%.
The estimated yield on the portfolio is currently 2.90%.
Since inception, the portfolio has returned 7.86% per annum (after fees).
|
Performance to 31 October 2017 |
1 Month |
3 Months |
6 Months |
1 Year |
2 Years |
3 Years |
SI (p.a) |
|
InvestSMART Core Growth |
2.85% |
4.24% |
2.77% |
13.11% |
6.38% |
7.31% |
7.86% |
|
Morningstar Aus Msec Growth TR AUD |
2.87% |
4.64% |
3.23% |
12.49% |
7.05% |
8.09% |
8.58% |
|
Excess to Benchmark |
-0.02% |
-0.40% |
-0.46% |
0.63% |
-0.67% |
-0.78% |
-0.72% |
|
RBA Cash Rate 3% |
0.37% |
1.13% |
2.27% |
4.59% |
4.76% |
4.95% |
4.95% |
|
Excess to Objective |
2.48% |
3.11% |
0.50% |
8.52% |
1.62% |
2.36% |
2.91% |
Figure 2: Portfolio Performance after fees
Source: InvestSMART
InvestSMART Diversified Income Portfolio
The InvestSMART Diversified Income Portfolio produced a return of 1.85% (after fees) during October.
The iShares Core S&P/ASX200 ETF (IOZ) was the best performing security for the month up 4.09%.
The estimated yield on the portfolio is currently 3.30%.
Since inception, the portfolio has returned 4.52% per annum (after fees).
|
Performance to 31 October 2017 |
1 Month |
3 Months |
6 Months |
1 Year |
2 Years |
SI (p.a) |
|
InvestSMART Diversified Income |
1.85% |
2.04% |
1.01% |
6.26% |
4.94% |
4.52% |
|
Morningstar Aus Msec Moderate TR AUD |
1.54% |
2.34% |
2.06% |
6.08% |
4.65% |
5.00% |
|
Excess to Benchmark |
0.31% |
-0.30% |
-1.05% |
0.18% |
0.29% |
-0.48% |
|
RBA Cash Rate 1% |
0.21% |
0.63% |
1.26% |
2.53% |
2.69% |
2.83% |
|
Excess to Objective |
1.65% |
1.42% |
-0.25% |
3.73% |
2.25% |
1.69% |
Figure 3: Portfolio Performance after fees
Source: InvestSMART
InvestSMART Interest Income Portfolio
The InvestSMART Interest Income Portfolio produced a return of 0.40% (after fees) during October.
The iShares Core Composite Bond ETF (IAF) was the best performing security for the month, up 0.82%.
The estimated yield on the portfolio is currently 2.41%.
Since inception, the portfolio has returned 2.20% per annum (after fees).
|
Performance to 31 October 2017 |
1 Month |
3 Months |
6 Months |
1 Year |
SI (p.a) |
|
InvestSMART Interest Income |
0.40% |
0.47% |
0.99% |
1.26% |
2.20% |
|
Bloomberg AusBond Composite 0 Y TR AUD |
1.09% |
0.77% |
1.28% |
1.64% |
3.34% |
|
Excess to Benchmark |
-0.69% |
-0.30% |
-0.29% |
-0.38% |
-1.14% |
Figure 4: Portfolio Performance after fees
Source: InvestSMART
InvestSMART Diversified Property & Infrastructure Portfolio
The InvestSMART Diversified Property & Infrastructure Portfolio produced a return of 1.60% (after fees) during October.
AGL Energy Limited (AGL) was the best performing security for the month up 8.11% while Westfield Corp (WFD) was worst performing at -0.89%.
The estimated yield on the portfolio is currently 3.20%.
Since inception, the portfolio has returned 4.78% per annum (after fees).
|
Performance to 31 October 2017 |
1 Month |
3 Months |
6 Months |
1 Year |
SI (p.a) |
|
InvestSMART Diversified Property & Infrastructure Portfolio |
1.60% |
1.65% |
-4.73% |
3.73% |
4.78% |
|
A Composite Index |
2.39% |
2.23% |
-3.82% |
6.00% |
6.61% |
|
Excess to Benchmark |
-0.80% |
-0.58% |
-0.90% |
-2.28% |
-1.83% |
Figure 5: Portfolio Performance after fees
Source: InvestSMART
InvestSMART International Equities Portfolio
The InvestSMART International Equities Portfolio produced a return of 4.52% (after fees) during October.
The iShares Asia 50 ETF (IAA) was the best performing security for the month up 8.70%.
The estimated yield on the portfolio is currently 2.02%.
Since inception, the portfolio has returned 11.97% per annum (after fees).
|
Performance to 31 October 2017 |
1 Month |
3 Months |
6 Months |
1 Year |
2 Years |
3 Years |
SI (p.a) |
|
InvestSMART International Equities |
4.52% |
8.30% |
6.78% |
20.70% |
6.47% |
11.14% |
11.97% |
|
MSCI World Ex Australia NR AUD |
4.28% |
8.74% |
6.97% |
22.00% |
7.43% |
13.37% |
14.21% |
|
Excess to Benchmark |
0.24% |
-0.45% |
-0.19% |
-1.30% |
-0.96% |
-2.23% |
-2.24% |
Figure 6: Portfolio Performance after fees
Source: InvestSMART
InvestSMART Hybrid Income Portfolio
The InvestSMART Hybrid Income Portfolio produced a return of 0.75% (after fees) during October.
NAB Convertible Preference Shares II (NABPB) was the best performing security for the month up 1.46% while the Macquarie Group Capital Notes 2 (MQGPB) was worst performing at -0.09%.
The estimated Gross Running Yield (incl. of franking) is currently 5.2% while the Yield to Maturity (incl. of franking) is 4.9%.
Since inception, the portfolio has returned 1.88% per annum (after fees).
|
Performance to 31 October 2017 |
1 Month |
3 Months |
SI (p.a) |
|
InvestSMART Hybrid Income |
0.75% |
1.77% |
1.88% |
|
RBA Cash Rate 3% |
0.37% |
1.13% |
1.51% |
|
Excess to Benchmark |
0.38% |
0.64% |
0.37% |
Figure 7: Portfolio Performance after fees
Source: InvestSMART


Frequently Asked Questions about this Article…
The InvestSMART Core Growth Portfolio is part of a diversified investment offering focused on growth. It has an asset allocation of 65-75% growth-oriented assets and 25-35% income-oriented assets. As of October 2017, it has returned 7.86% per annum since inception, with a 2.85% return in October alone.
The InvestSMART International Equities Portfolio offers exposure to global equity markets at a competitive cost of 0.77%, compared to other actively managed funds that charge 1.50% or more. It has returned 11.97% per annum since inception, slightly underperforming its benchmark.
ETFs are used in InvestSMART portfolios to provide a simple, low-cost investment solution that allows for diversification and helps investors achieve long-term investment objectives.
The InvestSMART Diversified Income Portfolio returned 1.85% in October 2017 and has an estimated yield of 3.30%. Since inception, it has returned 4.52% per annum.
The Core Growth Portfolio allocates 65-75% to growth-oriented assets like equities and property, and 25-35% to income-oriented assets such as interest income and cash, aiming for growth-focused returns.
The estimated yield of the InvestSMART Interest Income Portfolio is currently 2.41%, with a return of 0.40% in October 2017.
The InvestSMART Hybrid Income Portfolio generates returns through investments in hybrid securities, with a gross running yield of 5.2% and a yield to maturity of 4.9%. It returned 0.75% in October 2017.
The InvestSMART Diversified Property & Infrastructure Portfolio returned 1.60% in October 2017, with an estimated yield of 3.20%. Since inception, it has returned 4.78% per annum.


