InvestSMART Performance Update: January 2026


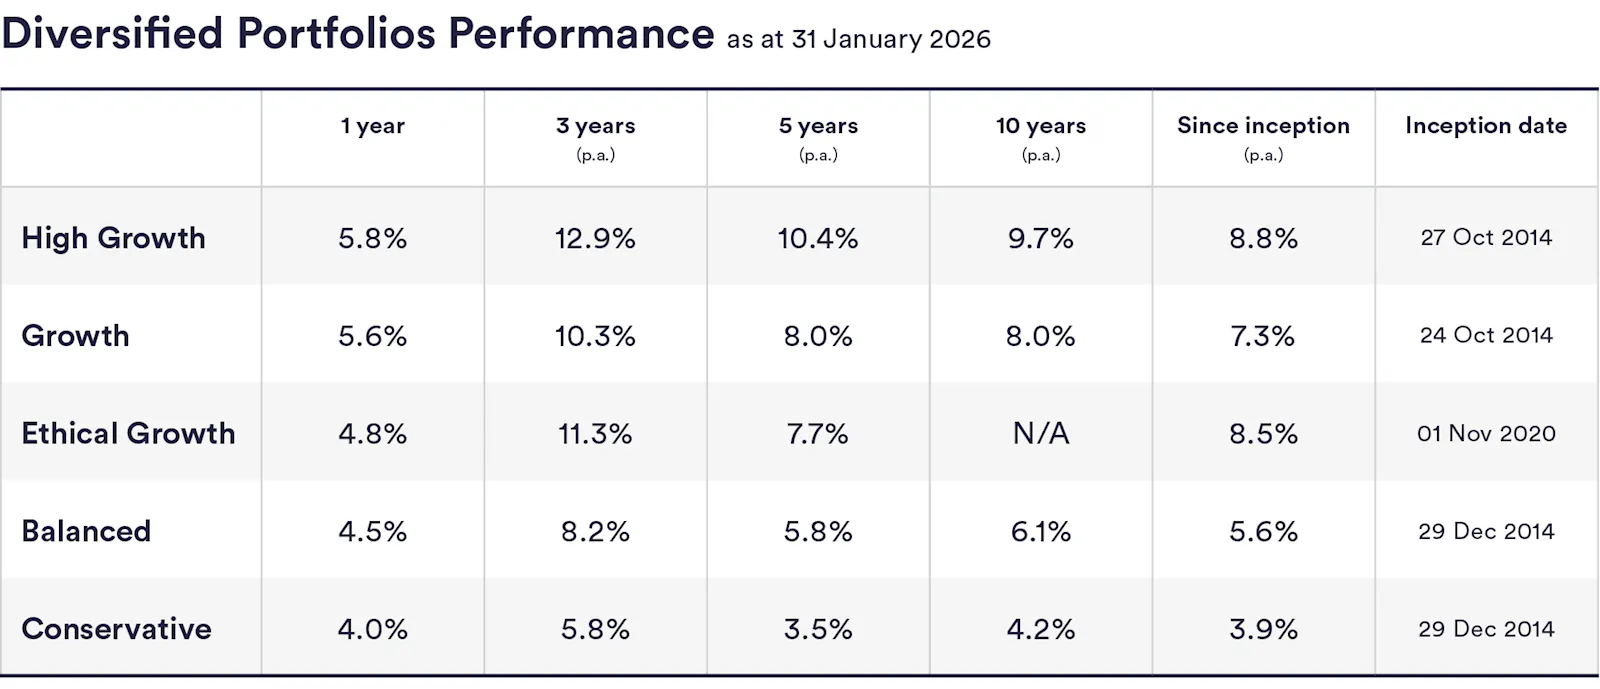
InvestSMART's diversified ETF portfolios have delivered solid results over the past 12 months, returning between 4.0% and 5.8% in the 12 months to the end of January 2026. Over 10 years, the diversified portfolios have returned between 4.2% and 9.7% a year on average. Keep in mind that past performance is not an indication of future performance.
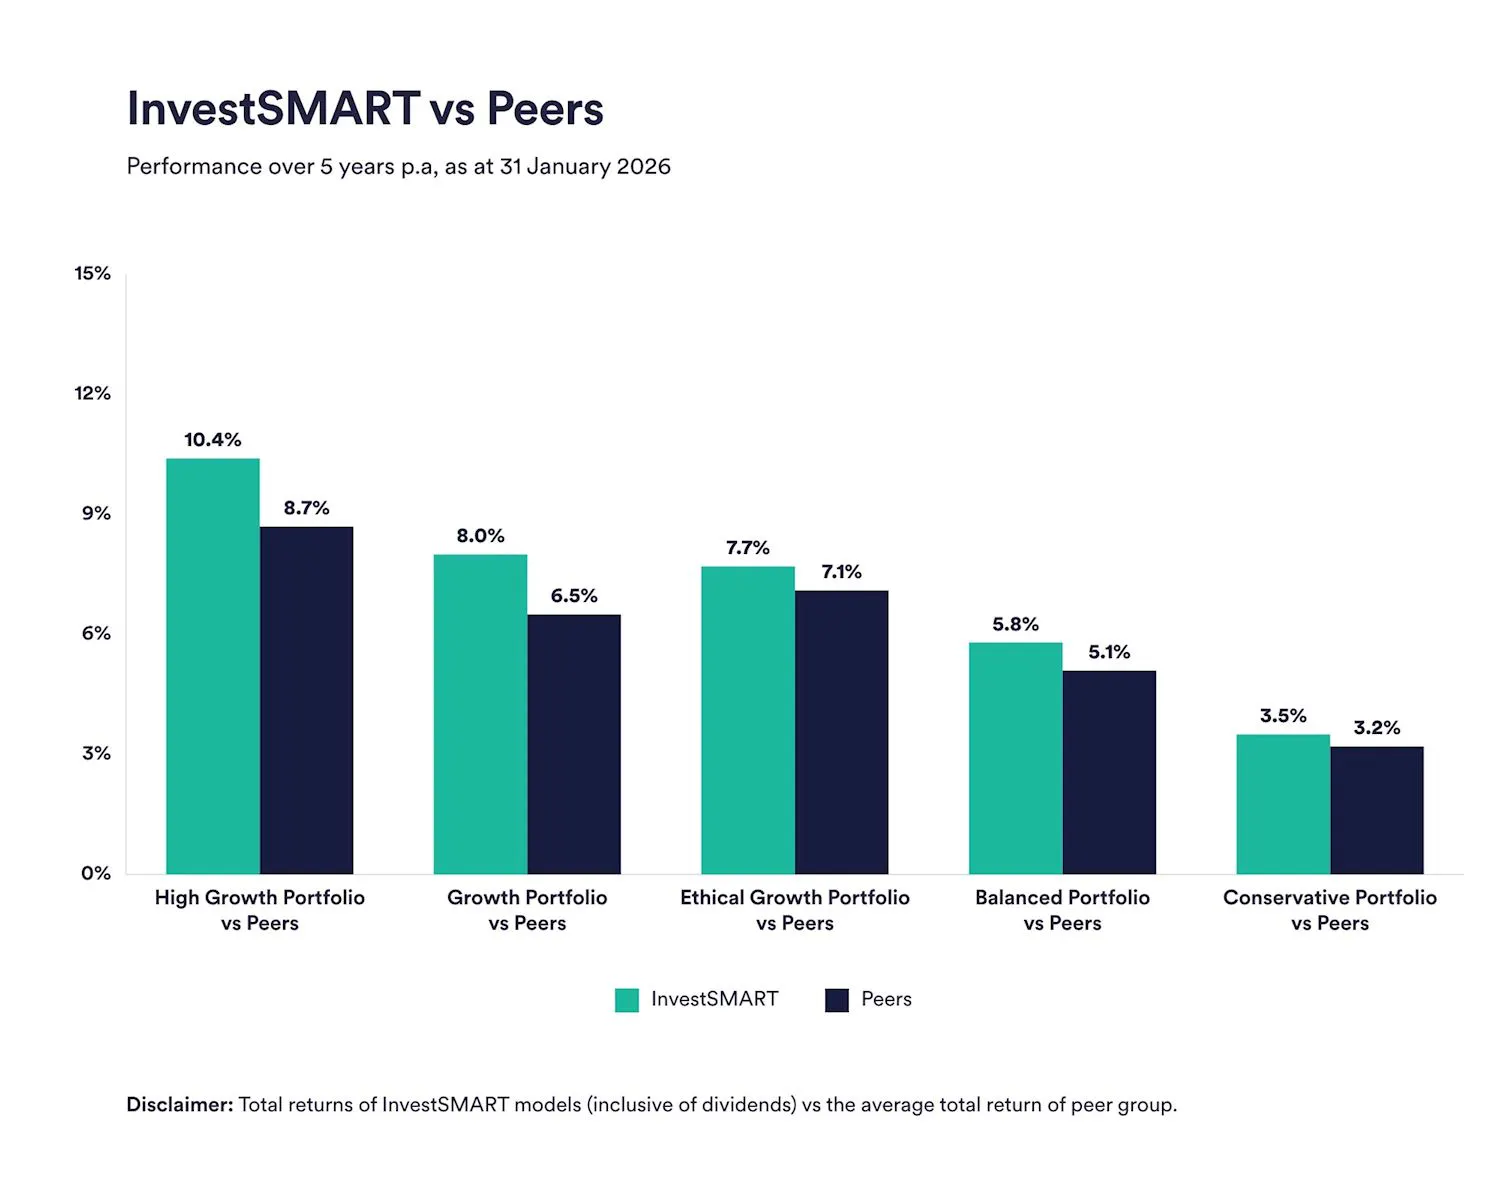
The chart below illustrates how InvestSMART's diversified portfolios have performed compared to funds in the same risk category over five years to 31 January 2026.
As you can see, over five years, the diversified portfolios have delivered annual returns of between 3.5% and 10.4% on average, outperforming competitor funds by an average annualised return of between 0.3% and 1.7%.
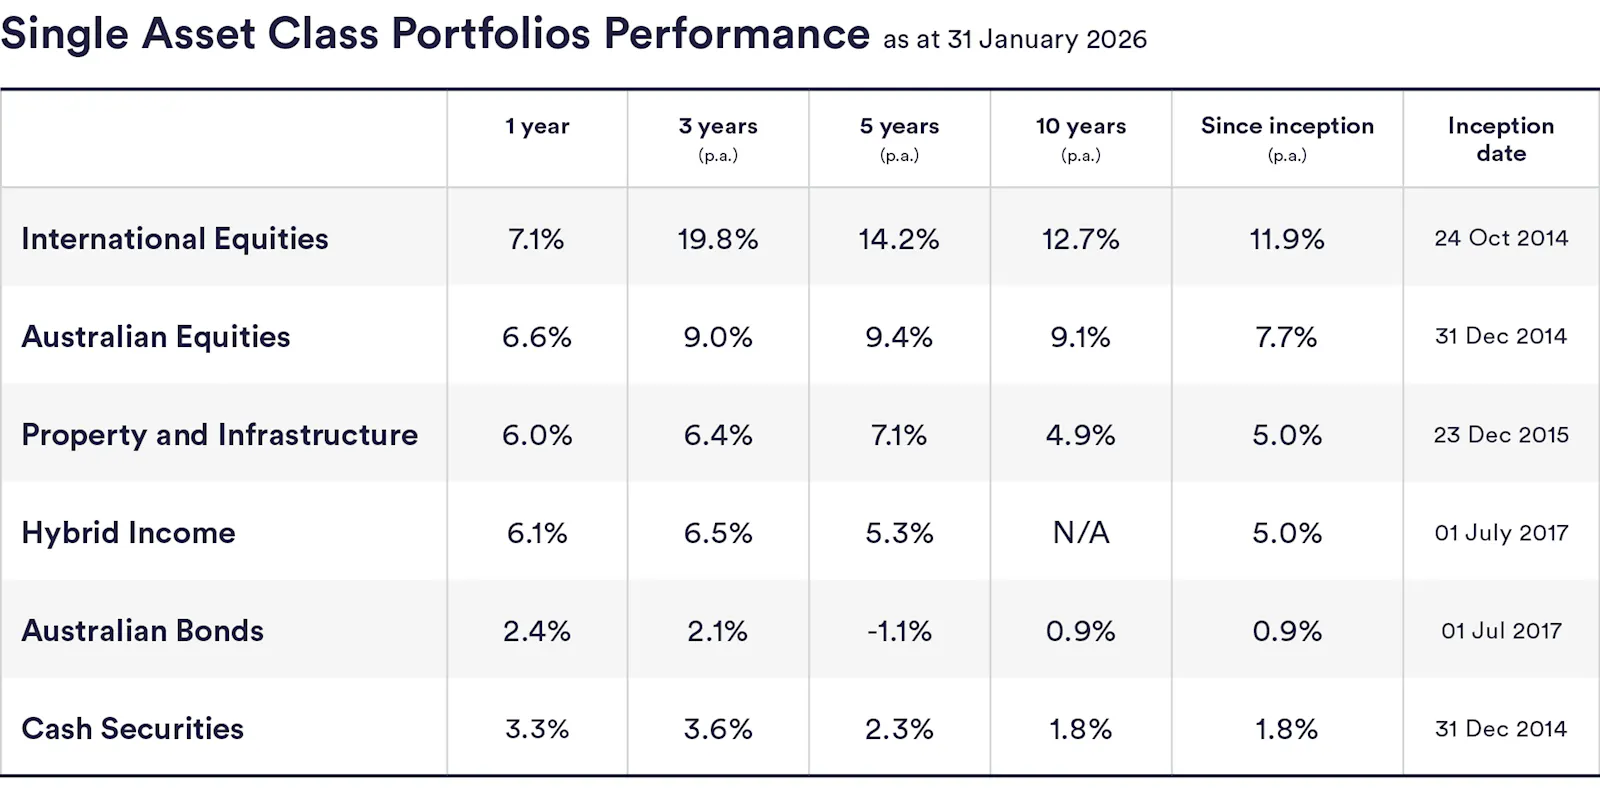
InvestSMART's single-asset portfolios returned between 2.4% (Australian bonds) and 7.1% (International equities) in the 12 months to the end of January 2026, and between -1.1% p.a. (Australian bonds) and 14.2% p.a. (International equities) over five years.
January wrap-up
January was a reminder that markets rarely move in a straight line. After a relatively positive start to the year, short bursts of selling emerged across Australian and global markets. Much of the volatility reflected shifting views on inflation and the path of rates.
Despite the swings, Australian shares still finished higher, with the S&P/ASX 200 up around 1.8% in January. Global markets were similarly choppy, but most ended the month in positive territory. The MSCI World ex Australia Index rose 1.6%, while the S&P 500 added 1.5%. Emerging markets and the broader Asian region (MSCI Asia ex Japan) were the clear standouts, posting gains of more than 8%.
After a surprise jump in inflation figures announced in late January, the Reserve Bank of Australia raised the official interest rate to 3.85% at its February meeting. This marked the first increase in more than two years.
Periods like this are often a reminder of a few simple investing principles - stay diversified, avoid big bets based on headlines and keep a long-term perspective.


Frequently Asked Questions about this Article…
InvestSMART's diversified ETF portfolios returned between 4.0% and 5.8% in the 12 months to the end of January 2026. The article also notes longer-term performance of the diversified portfolios, but reminds readers that past performance is not an indication of future performance.
Over five years to 31 January 2026, InvestSMART's diversified portfolios delivered average annual returns between 3.5% and 10.4%, outperforming competitor funds by about 0.3% to 1.7% per year. Over 10 years the diversified portfolios returned between 4.2% and 9.7% per year on average.
In the 12 months to the end of January 2026, InvestSMART's single-asset portfolios returned between 2.4% (Australian bonds) and 7.1% (International equities). Over five years those single-asset returns ranged from -1.1% p.a. (Australian bonds) to 14.2% p.a. (International equities).
January 2026 was choppy but overall positive: the S&P/ASX 200 finished up about 1.8%, the MSCI World ex Australia rose 1.6% and the S&P 500 added 1.5%. Emerging markets and the broader Asian region (MSCI Asia ex Japan) were the standouts, posting gains of more than 8%.
Short bursts of selling in late January reflected a surprise jump in inflation figures and shifting market views on inflation and the likely path of interest rates, which increased market volatility during the month.
Yes. After the late-January inflation surprise, the Reserve Bank of Australia raised the official cash rate to 3.85% at its February meeting — the first RBA rate increase in more than two years, according to the article.
The article reminds everyday investors to stay diversified, avoid making big bets based on headlines, and keep a long-term perspective when markets swing. These simple principles are offered as ways to manage volatility.
InvestSMART's performance figures give historical context on returns for diversified and single-asset portfolios, but the article cautions that past performance is not an indication of future performance. Use the data to understand track record while keeping diversification and a long-term focus in mind.


