InvestSMART Australian Exchange-Traded Product Quarterly Report - September 2018


Introduction
Highlights
Market Overview
Securities Overview
Introduction
About this report
Welcome to InvestSMART’s September Quarter 2018 Exchange Traded Products (ETP) update.
ETPs form the basis of InvestSMARTs form the basis of a range of InvestSMART’s Professionally Managed Accounts (PMAs). The purpose of this report is to provide our clients with an easy to digest wrap of market activity as well as provide a greater level of insight into how and why we’ve built our SMA portfolios the way we have.
ETPs are a low-cost, hassle-free way for investors to achieve their investment objectives. Whether your aim is to diversify your portfolio or to obtain exposure to a particular investment theme, the ability to buy ETPs directly on market, their transparency and relatively low cost has seen the popularity of these securities amongst investors grow rapidly.
We have categorised the ETP market by asset class to allow clients to quickly identify suitable securities to fill any investment gaps in their portfolio and remain aligned to their specific investment objectives.
Figure 1: Asset Classes
| Asset Class | Description |
|---|---|
| Commodities | Exchange Traded Products (ETPs) that provide exposure to various Commodities & Natural Resources. |
| Currency | Exchange Traded Products (ETPs) that provide exposure to various Currencies. |
| Diversified | Exchange Traded Products (ETPs) that provide Diversified Multi Sector exposure |
| Equities | Exchange Traded Products (ETPs) that provide exposure to Equity Markets. |
| Fixed Income & Cash | Exchange Traded Products (ETPs) that provide exposure to Interest Rate securities and Cash. |
| Property & Infrastructure | Exchange Traded Products (ETPs) that provide exposure to Domestic and Global Property and Infrastructure. |
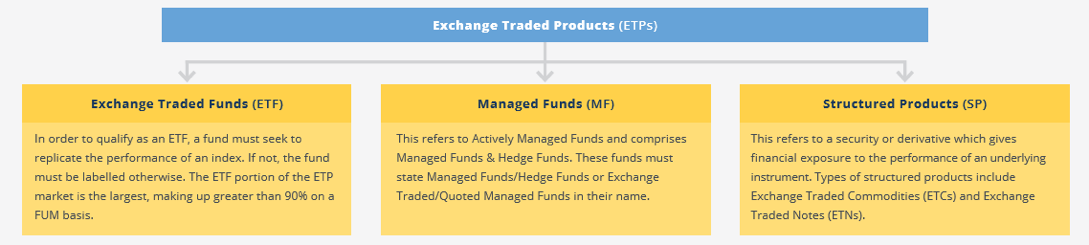
We also categorise ETPs throughout the report by their structure. This is an important consideration as each carries its own set of risks. ASIC has sought to clarify the naming conventions in its Information Sheet 230: Exchange traded products.
In conjunction with this report, clients have access to our ETP filter which can be used to quickly identify securities of interest.
Suitable for all investors as a total portfolio solution or the core of an investment plan.
Diversified
A diversified portfolio for those looking for a better return than cash or saving for the short-term.
Balanced
A diversified portfolio for investors seeking a conservative investment solution.
Core Growth
A diversified portfolio suitable if you’re looking to build your wealth over the medium-term.
High Growth
A diversified portfolio that aims to reward your patience and grow your wealth over the longer term.
About InvestSMART
Founded in 1999, InvestSMART Group Limited (ASX:INV) believes everyone should have the confidence to control their financial future and it shouldn’t be hard or expensive to do so.
Whether you’re managing your own investments or looking for a little help, we deliver straightforward, flexible and affordable solutions to ensure you are better able to meet your investment goals.
Our three leading brands – InvestSMART, Eureka Report and Intelligent Investor – together offer actionable investment tools, wealth advice and independent ASX-listed stock research.
We’re all about making investing simple. Statistics show four in five Australians do not receive any professional investment advice, with cost the primary reason. We aim to change that.
Through our Portfolio Manager, stock research, wealth commentary and affordable investment products, we believe we are delivering the right tools to help all Australians grow and protect their wealth.
InvestSMART Star Rating
Exchange Traded Products (ETPs) are a wonderful way for retail investors to obtain greater control of their wealth and build a fully diversified portfolio themselves at a low cost. As the Australian ETP market grows and more investment options become available, the InvestSMART rating system has been developed to assist investors objectively compare products.
It should be noted that the InvestSMART Star Rating is a quantitative measure and it does not take one’s investment objectives into account. The InvestSMART Star ratings do not constitute recommendations. Additionally, we do not rate Actively Managed Funds (MF) or Structured products (SP). This is because these products carry a different set of risk/ return metrics that are not easily quantifiable.
Finally, our ratings are designed for comparing ETFs with a similar objective. It is not appropriate for example to use the star rating to compare a highly liquid and low-cost S&P ASX 200 fund to one designed to track emerging markets.
There are five key criteria we use:
Figure 2: InvestSMART Star Rating Criteria
| Factor | Description |
|---|---|
| Size | Size refers to funds under management. Size is important, as smaller funds are at risk of being closed where it is not economical for the issuer to run them. |
| Fees | Fees refer to the management fee charged by the issuer. All else being equal, lower fees result in higher returns. |
| Liquidity | While historical trading volumes are not necessarily reflective of total liquidity, it does provide an indication of the ability for investors to execute orders quickly at prices close to Net Asset Value (NAV). |
| Spread | This is the difference between the bid and the offer price, expressed as a %. As an ETF is designed to trade around its NAV, the spread represents a cost to the investor. |
| Tracking error | TETFs are designed to replicate the performance of their stated benchmark. This metric represents how close the funds performance is tracking to its benchmark. Like the spread, tracking error represents a cost to the investor. |
Figure 3: Number of ETFs per star rating
| Star Rating | Count |
|---|---|
| 5 Stars | 10 |
| 4 Stars | 38 |
| 3 Stars | 59 |
| 2 Stars | 32 |
| 1 Star | 5 |
| NR | 37 |
| Total | 181 |
Highlights this quarter
How do ETFs track an index?
Exchange Traded Funds (ETFs) were developed to allow investors the ability to invest in an index. As we have discussed previously, how well an issuer is doing this is captured in the tracking error. We speak about this in our March 2018 Report. Given the wide range of geographies and asset classes that investors can now invest in via ETFs, it is important to understand that not all ETFs are constructed equally, and each carry varying forms of risk.
Replication Methods
The ways in which issuers elect to manage their fund can be categorised under two broad headings, namely ‘physical’ and ‘synthetic’ replication.
Physical
As the name implies, this method involves physically holding the securities in the index. However, the degree to which the issuer holds underlying securities can vary.
-
Full Replication
If an ETF is fully replicating, the issuer will hold securities in the portfolio on a 1:1 basis to the index. This is often the choice for managing ETFs that track liquid, easily accessed indices such as the ASX200 or Dow Jones.
If an ETF is fully replicating, the issuer will hold securities in the portfolio on a 1:1 basis to the index. This is often the choice for managing ETFs that track liquid, easily accessed indices such as the ASX200 or Dow Jones.
-
Partial Replication
Partial replication, often referred to as optimisation or sampling, is used where the underlying index is comprised of a large number of securities (sometimes into the thousands) or those designed to track less liquid securities where the transaction costs of holding every security outweighs the benefits of full replication.
Partial replication strategies carry an increased tracking error risk, or the risk that your fund will not perform in line with the benchmark as closely as a fully replicating fund, however issuers are constantly working to ensure minimal tracking error.
Synthetic
Synthetic replication involves the use of derivatives, such as swaps, to deliver index returns. The most common reasons as to why an issuer may choose to adopt a synthetic structure includes:
- Physical holdings are impractical: Often the case for commodities such as oil and agricultural products
- Complex Strategies: Leveraged & inverse strategies require derivatives to deliver desired outcomes.
- Market Restrictions: For example, the China A-Shares market does not allow for foreign investment
Synthetic strategies carry an additional layer of risk in the form of counter party risk.
Figure 4: Replication methods.
| Physical | Synthetic | ||
|---|---|---|---|
| Method | Full Replication | Partial/Optimised | |
| Description | The index is replicated 1:1 | Holds a selection of securities | Replication via financial derivatives (swaps) |
| Typical characteristics of index components | Liquid securities | Less liquid to illiquid securities | Liquid and illiquid, investment restrictions |
| Typical number of securities in index | Low(er) | High | Low to high |
| Example ETF | IOZ, VAP | FLOT, IAF | BEAR, OOO |
Ways to use Exchange Traded Products
At a basic level, ETPs allow an investor to get exposure to, and maintain a portfolio of securities in a couple of clicks. However, ETPs are more than just market trackers used by lazy investors. They offer a way for retail investors to manage their money like financial professionals, at a fraction of the cost.
Diversification (strategic asset allocation)
ETPs are a great way for investors to manage portfolio diversification themselves as they allow you to invest in asset classes which you may not be familiar with, such as bonds or hybrids or have access to, such as international equities or infrastructure assets. In constructing our diversified portfolios, we use the following ETPs to access various asset classes.
Figure 5: 5 cheapest ETFs. Source: ASX, Morningstar.
| Asset Class | Ticker | Security |
|---|---|---|
| Domestic Equities | IOZ | iShares Core S&P/ASX 200 ETF |
| Domestic Bonds - Fixed | IAF | iShares Core Composite Bond ETF |
| Domestic Bonds - Floating | FLOT | VanEck Vectors Australian Floating Rate ETF |
| International Equities | VGS | Vanguard MSCI Index International Shares ETF |
| International Bonds | VBND | Vanguard Global Aggregate Bond Index (Hedged) ETF |
| Domestic Property | VAP | VanEck Vectors FTSE Global Infrastructure (Hedged) ETF |
Source: ASX and Morningstar
Acting as a stop gap
Great investment ideas aren’t always easy to find, however sitting in cash for too long can be detrimental to long term performance outcomes. During such times, ETPs offer a way in which to remain exposed to the market. The great thing being that when you need to liquidate you can sell immediately with no additional paperwork or exit fee penalties.
Trading positions
As ETPs are priced intraday and can be bought or sold rapidly during market hours, they offer a way for investors to position themselves based on a view in real time without the need for specialised product knowledge (eg, options or CFDs). For example, those seeking to profit from a falling US market may look to purchase units in BBUS (BetaShares US Equities Strong Bear Hedged). Or, if you have a strong view on the future positive performance of the Australia equity market, you could invest in GEAR (BetaShares Geared Australian Equity (Hedged).
Exposure to a sector or theme (tactical asset allocation)
As the local market matures, there is an increasing number of ETPs being listed that are designed to provide exposure to particular sectors or themes. Some examples are listed below.
Sectors
There are a number of ETPs now that are designed to provide exposure to a particular sub-sector, for example banks, resources & healthcare. These products provide an ideal way to quickly invest in an undervalued sector in one trade.
Figure 6: Sectors
| Ticker | Security |
|---|---|
| BNKS | BetaShares Global Banks ETF - Currency Hedged |
| FOOD | BetaShares Global Agriculture Companies ETF - Currency Hedged |
| FUEL | BetaShares Global Energy Companies ETF - Currency Hedged |
| GDX | Market Vectors Gold Miners ETF |
| IXI | iShares Global Consumer Staples ETF (AU) |
| IXJ | iShares Global Healthcare ETF (AU) |
| MVB | VanEck Vectors Australian Banks ETF |
| OZR | SPDR S&P/ASX 200 Resources ETF |
| QFN | BetaShares S&P/ASX200 Financials Sector ETF |
Source: ASX and Morningstar
Themes
Aside from investing in the performance of broad exposures such as domestic small cap or European shares, there is a growing number of ETPs designed to capture the performance of particular macro thematics. For example,
Figure 7: Sectors
| Ticker | Security |
|---|---|
| ACDC | ETFS Battery Tech and Lithium |
| ASIA | BetaShares Asia Technology Tigers ETF |
| HACK | Betashares Global Cybersecurity ETF |
| RBTZ | BetaShares Global Robotic & Artificial Intelligence ETF |
| ROBO | ETFS ROBO Global Robotics and Automation ETF |
| TECH | ETFS Morningstar Global Technology ETF |
Source: ASX and Morningstar
We caught up with ETF Securities head Kris Walesby recently to chat about ACDC. You can watch here.
Portfolio Strategy
There are several key thematics that are beginning to impact markets and will likely be key to markets over the coming 12 months. These are:
- Rising bond yields
- Tighter financial conditions
- Equity risk premiums topping out
We have already started to see the final quarter being impacted by these thematics with October seeing an equity correction, US bonds yields climbing to five-year highs and the cost of capital increasing further due to another rise in the US Federal Funds rate. The cost of capital will rise further, with the US Federal Reserve forecasting ‘gradual rate raises’ all the way to December 2019.
We point out that these thematics are being created by good economics: US growth is booming, inflation is finally materialising, and not just in the US, employment is powering ahead, which is creating confidence, and corporate earnings are expanding strongly on a year-on-year basis. However, this kind of data does tend to occur in the latter part of a growth cycle and explains why central banks will begin to tighten policy to avoid overheating.
These thematics form the basis for our strategy for the coming 12 months, which is a slow rotation out of ‘Growth’ and a stretched equity market and towards ‘Value’ and ‘Defensive’ indices and sectors.
Market Overview


Source: ASX and Morningstar
Funds under management (FUM)
We also saw 2 funds closing, ETF Securities Physical Singapore Gold ETF (ZGOL) and ETF Securities Physical Renminbi ETF (ZNCH) taking the total number of products on the ASX to 181.
At the end of September, the amount of capital in Australian-listed ETPs exceeded those in Listed Investment Companies (LICs) for the first time.
Flows
Like last quarter, ‘Equity Large Blend’ again saw standout inflows suggesting continuing interest in overseas investment. At the other end, ‘Equity Australia other’ saw the largest outflows, mainly due to large outflows in resource related securities VanEck Vectors Australian Resources ETF (MVR) & the BetaShares S&P/ASX200 Resources Sector ETF (QRE).
Looking ahead and flows have begun to rotate, October has seen large outflows from Developed Market funds, particularly the US. Over US$15.2 billion left US ETP funds in the second week of October while Europe and Global funds saw US$4.8 billion and US$4.0 billion of outflows respectively. Interestingly, large inflows where seen in Emerging Markets, particularly into China funds, which saw US$2.4 billion of inflow in the same week. This would fit with our view that ‘Value’ is likely to be rotated into.
Globally, ETPs are on track for their second-best year of capital inflows in the past 16 years. On a year-to-date basis global ETPs have seen US$200 billion of inflows with a quarter to go. Last year was the biggest year, with over US$420 billion of inflows*
* Morgan Stanley – 17/10/2018.
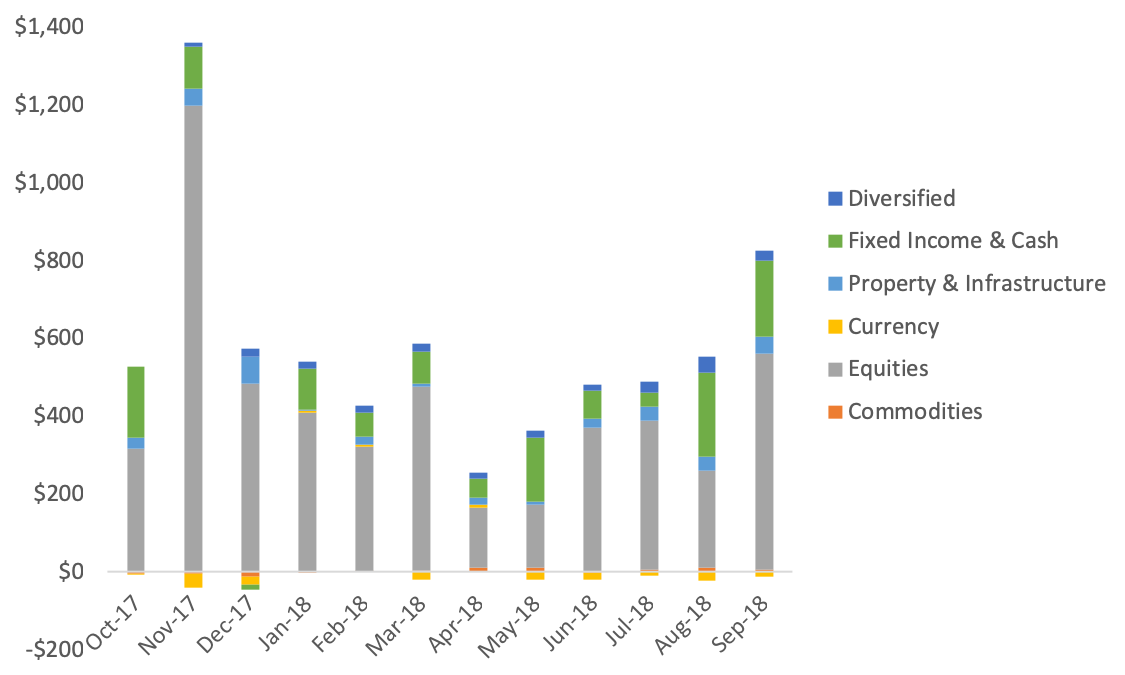
Figure 8: Quarterly Flows
Source: ASX and Morningstar
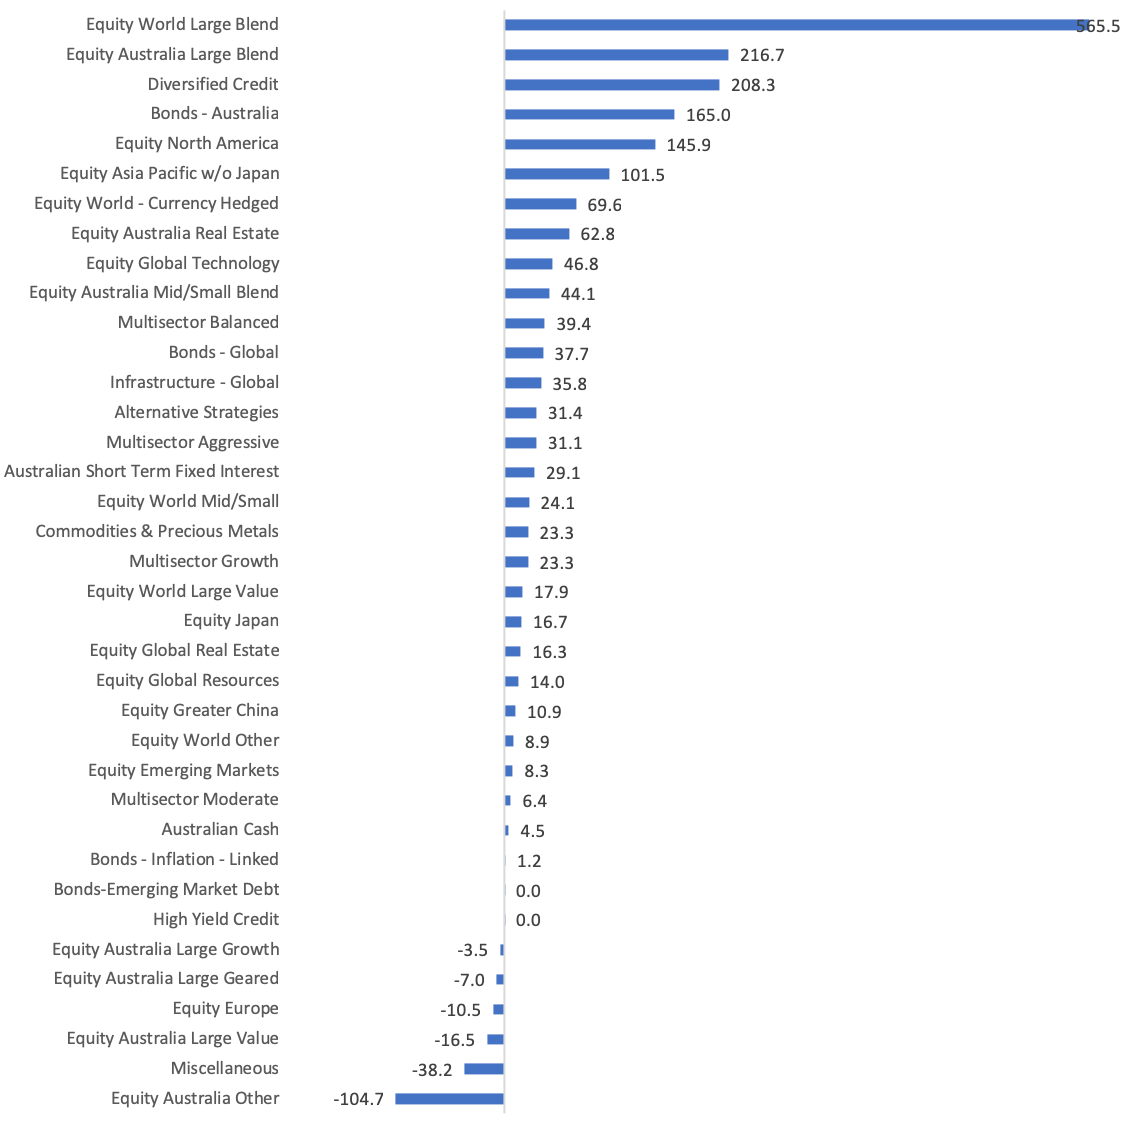
Figure 9: Cumulative FUM Flows ($M)

Source: ASX and Morningstar
Figure 10: FUM Flows ($M) by Asset Class
Source: ASX and Morningstar
Figure 11: Largest Inflows (QTR)
| ETF | Qtr Flows ($m) | Sub Category |
|---|---|---|
| [VAS] Vanguard Australian Shares ETF | $147.68 | Equity Australia Large Blend |
| [A200] BetaShares Australia 200 ETF | $123.68 | Equity Australia Large Blend |
| [VGS] Vanguard MSCI Index International ETF | $116.87 | Equity World Large Blend |
| [MVW] VanEck Vectors Australian Equal Wt ETF | $86.39 | Equity Australia Large Blend |
| [FAIR] BetaShares Australian Sustnby Leaders ETF | $85.29 | Australian Cash |
Source: ASX and Morningstar
Figure 12: Largest Outflows (QTR)
| ETF | Qtr Flows ($m) | Sub Category |
|---|---|---|
| [STW] SPDR S&P/ASX 200 ETF | $(171.03) | Equity Australia Large Blend |
| [AAA] BetaShares Australian High Interest Cash ETF | $(80.81) | Australian Cash |
| [QRE] BetaShares S&P/ASX200 Res Sect ETF | $(78.61) | Equity Australia Other |
| [QOZ] BetaShares FTSE RAFI Australia 200 ETF | $(66.53) | Equity Australia Large Blend |
| [USD] BetaShares US Dollar ETF | $(37.54) | Miscellaneous |
Source: ASX and Morningstar
Performance
While international equities in general saw strong performance this quarter, global tech was the standout performer on average. The best performing security in the category being Betashares Cyber Security ETF (HACK). It was a fairly poor quarter for commodity related funds though, with 4 of the 5 worst performing all leveraged to that sector.
Figure 13: Top Five Performing Securities
| ETF | 3 Mnth Return | Sub Category |
|---|---|---|
| [GGUS] BetaShares Geared US Equities - Currency Hedged | 18.06% | Equity World - Currency Hedged |
| [ETPMPD] ETFS Physical Palladium ETC | 17.08% | Commodities & Precious Metals |
| [IXJ] iShares Global Healthcare ETF (AU) | 13.93% | Equity World Other |
| [DRUG] BetaShares Global Healthcare ETF - Currency Hedged | 12.44% | Equity World Other |
| [NDQ] BetaShares NASDAQ 100 ETF | 10.74% | Equity North America |
Source: ASX and Morningstar
Figure 14: Worst Five Performing Securities
| ETF | 3 Mnth Return | Sub Category |
|---|---|---|
| [MNRS] BetaShares Global Gold Miners ETF - Currency Hedged | -17.99% | Equity Global Resources |
| [BBUS] BetaShares US Equities Strong Bear Hedged - Currency Hedged | -15.31% | Alternative Strategies |
| [GDX] Market Vectors Gold Miners ETF | -15.09% | Equity Global Resources |
| [ETPMAG] ETFS Physical Silver ETC | -8.99% | Commodities & Precious Metals |
| [QAU] BetaShares Gold Bullion ETF Currency Hedged | -5.66% | Commodities & Precious Metals |
Source: ASX and Morningstar
Figure 15: Returns 3 and 12 months
Source: ASX and Morningstar| 3 Month |
|---|
 |
| 12 Month |
 |
Source: ASX and Morningstar
Figure 16: Sub-category volatility

In finance, volatility implies risk. That is the higher the volatility, the higher the risk. Per below, you can see that the categories to the left of the chart, or more volatile, generally include leveraged, equity and commodity focused securities. To the right we find cash & bonds focused securities.
We are strong supporters of the benefits of diversification, that is spreading your portfolio across various asset classes for the purposes of reducing risk, and it is interesting to note that despite having allocations to equities, the diversified funds lie toward the low risk end of the spectrum, highlighting the benefit of diversification for risk averse investors.
Securities Overview - Commodities
| Commodities | FUM ($m) | Qtr Flows ($m) | No. of Funds |
|---|---|---|---|
| $ 775.00 | $23.50 | 9 |
Source: ASX and Morningstar
Securities designed to provide exposure to the performance of various commodities and natural resources. We do not hold any commodity focused ETPs in our PMA Portfolios.
With volatility increasing and global fixed income markets under pressure flows have been seen into precious metals with gold up over 5% to start October. If global risk continues it likely precious metal ETPs’ will see further inflows in the coming months.
Industrial metals have suffered at the hands of US-China trade relations and weak industrial production from China. However, China has recently announced that it will ‘provide unwavering support for its private sector’ which has seen a copper and aluminium starting October in a more positive fashion.
Energy markets are moving into the traditionally ‘high demand’ season with the North Hemisphere moving into winter. The high demand period is coupled with supply concerns from the new Iranian trade sanctions and geopolitical tensions with Saudi Arabia. However, the US has reported that it has doubled its inventories to start October and US rig counts are at 2015 high which is likely to see oil moderate over the medium term.
Source: ASX and Morningstar| Figure 17: Funds Under Management ($m) | Figure 18: Geographic Exposure |
|---|---|
 |
 |
| Figure 19: Flows ($m) | |
 |
|
| Figure 20: Average Yield | |
 |
|
| Figure 21: Total Costs | |
 |
|
| Figure 22: Performance | |
 |
|
| Figure 23: Average Annual Volatility | |
 |
|
Figure 24: Commodities ETFs
| Name | Total FUM | Qtr Flows ($M) | MER | Avg Spread | Avg Liquidity | 3MTH Return | 12MTH Return | Yield | Frequency | Structure | Sub Category | STAR Rating | |
|---|---|---|---|---|---|---|---|---|---|---|---|---|---|
| GLOBAL | |||||||||||||
| Agriculture | |||||||||||||
| [QAG] BetaShares Agriculture ETF Currency Hedged (Synth) | 3.11 | 0.25 | 0.69% | 0.82% | 14.67% | -4.41% | -12.52% | 0.00% | Annual | ETF | Miscellaneous | 2 | |
| Diversified Commodities | |||||||||||||
| [ETPMPM] ETFS Physical PM Basket ETC | 6.21 | 1.22 | 0.44% | 0.55% | 9.90% | -0.26% | 2.77% | 0.00% | Semi-Annual | SP | Commodities & Precious Metals | NR | |
| [QCB] BetaShares Com Basket ETF Currency Hedged (Synth) | 10.16 | 0.12 | 0.69% | 0.86% | 15.68% | -2.10% | 4.84% | 8.78% | Annual | ETF | Commodities & Precious Metals | 2 | |
| Gold. | |||||||||||||
| [GOLD] ETFS Physical Gold ETC | 587.33 | 15.59 | 0.40% | 0.09% | 4.24% | -3.14% | -0.06% | 0.00% | Semi-Annual | Share | Commodities & Precious Metals | NR | |
| [QAU] BetaShares Gold Bullion ETF Currency Hedged | 60.23 | 5.96 | 0.59% | 0.25% | 6.38% | -5.66% | -9.38% | 0.00% | Annual | ETF | Commodities & Precious Metals | 2 | |
| Oil | |||||||||||||
| [OOO] BetaShares Crude Oil ETF Currency Hedged (Synth) | 30.35 | -2.54 | 0.69% | 0.26% | 11.14% | 2.12% | 46.10% | 1.28% | Annual | ETF | Commodities & Precious Metals | 2 | |
| Palladium | |||||||||||||
| [ETPMPD] ETFS Physical Palladium ETC | 1.14 | $- | 0.49% | 1.60% | 3.88% | 17.08% | 26.27% | 0.00% | Quarterly | SP | Commodities & Precious Metals | NR | |
| Platinum | |||||||||||||
| [ETPMPT] ETFS Physical Platinum ETC | 1.66 | 0.52 | 0.49% | 0.40% | 3.86% | -2.32% | -4.40% | 0.00% | Quarterly | SP | Commodities & Precious Metals | NR | |
| Silver | |||||||||||||
| [ETPMAG] ETFS Physical Silver ETC | 55.35 | 2.42 | 0.49% | 0.29% | 4.95% | -8.99% | -8.44% | 0.00% | Semi-Annual | SP | Commodities & Precious Metals | NR | |
Source: ASX and Morningstar
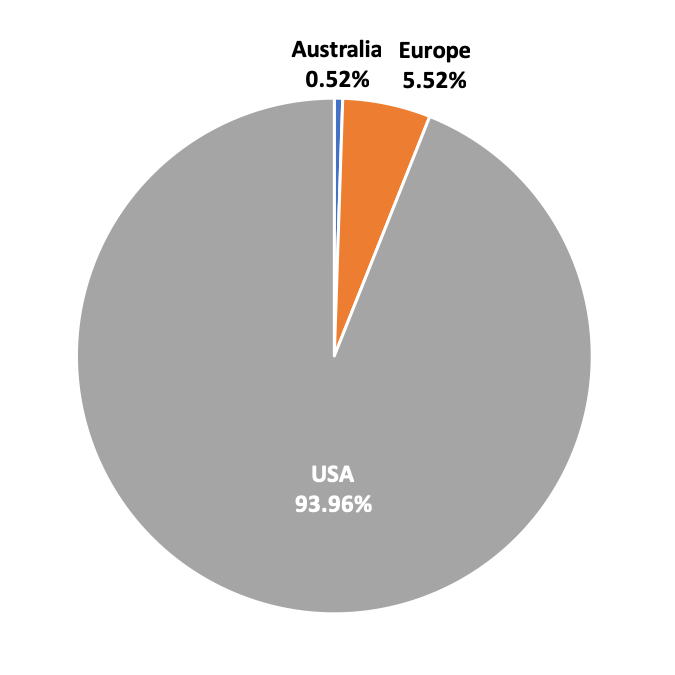
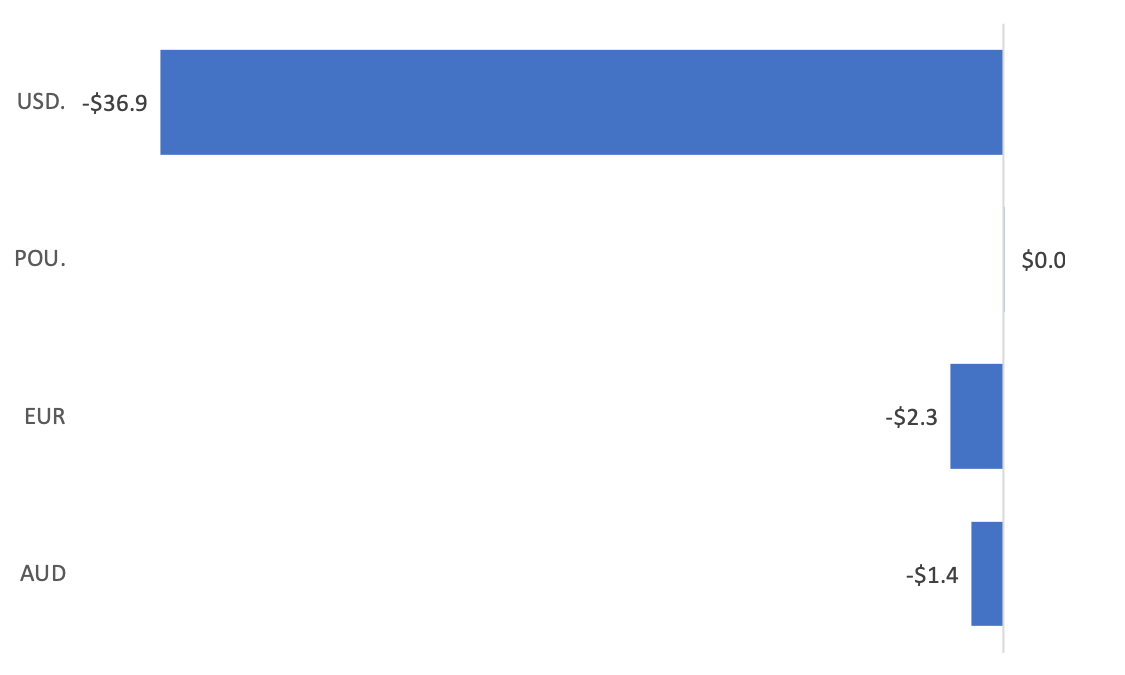
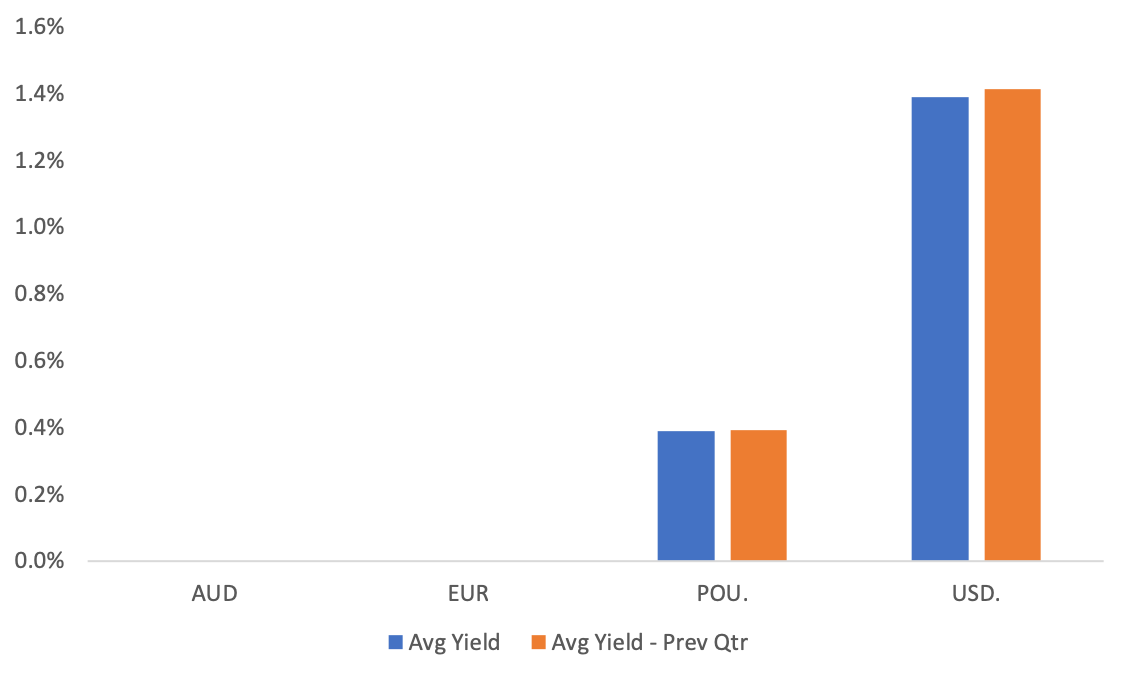
Securities Overview - Currency
| Currency | FUM ($m) | Qtr Flows ($m) | No. of Funds |
|---|---|---|---|
| $ 496.00 | $(40.60) | 6 |
Source: ASX and Morningstar
Securities designed to track the performance of the Australian dollar relative to various currencies. We do not hold any currency focused ETPs in our PMA Portfolios.
The AUD is facing further headwinds in the coming months being a ‘risk’ currency exposed to emerging markets. This coupled with the head winds of higher US interest rates is likely to mean the AUD will be at or below currently levels to finish 2018.
Source: ASX and Morningstar| Figure 25: Funds Under Management ($m) | Figure 26: Geographic Exposure |
|---|---|
 |
 |
| Figure 27: Flows ($m) | |
 |
|
| Figure 28: Average Yield | |
 |
|
| Figure 27: Total Costs | |
 |
|
| Figure 28: Performance | |
 |
|
| Figure 29: Average Annual Volatility | |
 |
|
Figure 30: Currency ETFs
| Name | Total FUM | Qtr Flows ($M) | MER | Avg Spread | Avg Liquidity | 3MTH Return | 12MTH Return | Yield | Frequency | Structure | Sub Category | STAR Rating | |
|---|---|---|---|---|---|---|---|---|---|---|---|---|---|
| EUROPE | |||||||||||||
| [EEU] BetaShares Euro ETF | 6.08 | -2.31 | 0.45% | 0.15% | 7.89% | 1.47% | 6.07% | 0.00% | Semi-Annual | ETF | Miscellaneous | 3 | |
| [POU] BetaShares British Pound ETF | 21.30 | 0.01 | 0.45% | 0.10% | 12.90% | 0.88% | 5.33% | 0.39% | Semi-Annual | ETF | Miscellaneous | 3 | |
| AUSTRALIA | |||||||||||||
| [AUDS] BetaShares Strong Australian Dollar Hedged | 2.62 | -1.41 | 1.38% | 0.21% | 185.04% | -5.60% | -19.79% | 0.00% | Annual | MF | Alternative Strategies | NR | |
| USA | |||||||||||||
| [USD] BetaShares US Dollar ETF | 433.79 | -37.54 | 0.45% | 0.09% | 10.10% | 2.42% | 9.21% | 0.78% | Semi-Annual | ETF | Miscellaneous | 5 | |
| [YANK] BetaShares Strong US Dollar Hedge | 11.25 | -0.75 | 1.38% | 0.20% | 93.66% | 5.03% | 18.71% | 2.91% | Annual | MF | Alternative Strategies | NR | |
| [ZUSD] ETFS Physical US Dollar ETF | 21.67 | 1.40 | 0.30% | 0.20% | 12.59% | 2.32% | 9.35% | 0.48% | Annual | ETF | Miscellaneous | 2 | |
Source: ASX and Morningstar
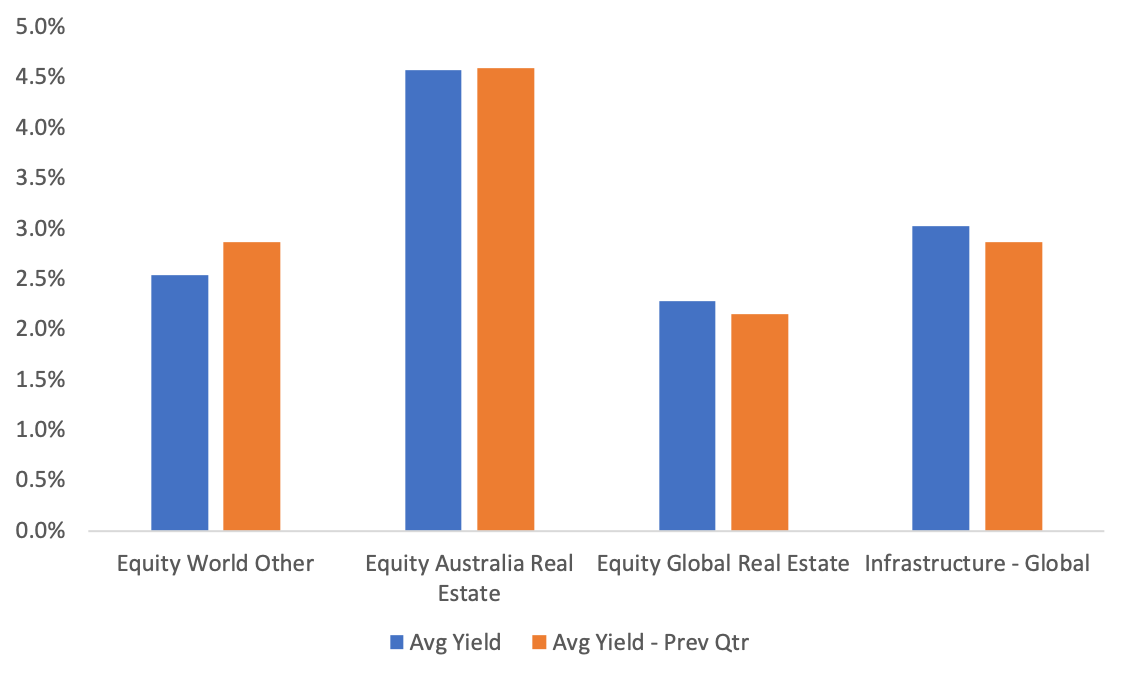
Securities Overview - Property & Infrastructure
| Property & Infrastructure | FUM ($m) | Qtr Flows ($m) | No. of Funds |
|---|---|---|---|
| $ 2,393.00 | $114.90 | 10 |
Source: ASX and Morningstar
Securities designed to track various domestic and global property & infrastructure indices. We hold positions in VAP, IFRA & DJRE in our PMA Portfolios.
We have seen downward pressure in infrastructure products due to the ‘bond-proxy’ nature. With interest rates forecasted to increase over the coming year it is likely this pressure will continue into 2019. Listed property however has managed to perform well in 2018 as rental yields from industrial property remains robust. We would also point out that although residential housing in Australia is falling, listed property is more commercially exposure which is weathering the down turn well.
Source: ASX and Morningstar| Figure 31: Funds Under Management ($m) | Figure 32: Geographic Exposure |
|---|---|
 |
 |
| Figure 33: Flows ($m) | |
 |
|
| Figure 34: Average Yield | |
 |
|
| Figure 35: Total Costs | |
 |
|
| Figure 36: Performance | |
 |
|
| Figure 37: Average Annual Volatility | |
 |
|
Invest in the InvestSMART Property and Infrastructure Portfolio - Now with capped fees
Figure 38: Property and Infrastructure ETFs
| Name | Total FUM | Qtr Flows ($M) | MER | Avg Spread | Avg Liquidity | 3MTH Return | 12MTH Return | Yield | Frequency | Structure | Sub Category | STAR Rating | |
|---|---|---|---|---|---|---|---|---|---|---|---|---|---|
| AUSTRALIA | |||||||||||||
| Property | |||||||||||||
| [MVA] VanEck Vectors Australian Property ETF | 128.78 | 7.53 | 0.35% | 0.16% | 5.12% | 3.83% | 13.55% | 4.70% | Semi-Annual | ETF | Equity Australia Real Estate | 4 | |
| [SLF] SPDR S&P/ASX 200 Listed Property ETF | 556.34 | -3.91 | 0.40% | 0.15% | 2.84% | 7.18% | 18.59% | 8.45% | Quarterly | ETF | Equity Australia Real Estate | 4 | |
| [VAP] Vanguard Australian Property Securities ETF | 1,098.94 | 54.53 | 0.23% | 0.11% | 4.51% | 1.91% | 13.06% | 2.64% | Quarterly | ETF | Equity Australia Real Estate | 4 | |
| Property & Infrastructure | |||||||||||||
| [RINC] BetaShares Legg Mason Real Income Fund | 14.86 | 4.65 | 0.85% | 0.45% | 12.31% | -0.07% | 0.00% | 2.48% | Quarterly | MF | Equity Australia Real Estate | NR | |
| GLOBAL | |||||||||||||
| Infrastructure | |||||||||||||
| [GLIN] AMP Capital - Global Infrastructure Securities Unhedged | 22.83 | -1.11 | 0.85% | 0.69% | 4.73% | 1.83% | 6.26% | 2.40% | Quarterly | MF | Infrastructure - Global | NR | |
| [IFRA] VanEck Vectors FTSE Global Infrastructure (Hedged) ETF | 83.10 | 7.01 | 0.52% | 0.21% | 7.42% | -0.03% | 2.77% | 3.90% | Quarterly | ETF | Infrastructure - Global | 3 | |
| [MICH] Magellan Infrastructure Currency Hedged ETF | 208.26 | 29.92 | 1.05% | 0.42% | 6.04% | -0.13% | 5.71% | 2.76% | Semi-Annual | MF | Infrastructure - Global | NR | |
| [CORE] ETFS Global Core Infrastructure ETF | 3.24 | 0.00 | 0.45% | 0.61% | 8.26% | 2.99% | 9.25% | 2.53% | Quarterly | ETF | Equity World Other | 2 | |
| Property | |||||||||||||
| [DJRE] SPDR Dow Jones Global Real Estate ETF | 260.65 | 15.21 | 0.50% | 0.16% | 5.66% | 1.30% | 11.07% | 3.16% | Semi-Annual | ETF | Equity Global Real Estate | 3 | |
| [RENT] AMP Capital - Global Property Securities Unhedged | 16.20 | 1.04 | 0.99% | 0.77% | 3.07% | 2.28% | 13.44% | 1.40% | Quarterly | MF | Equity Global Real Estate | NR | |
Source: ASX and Morningstar
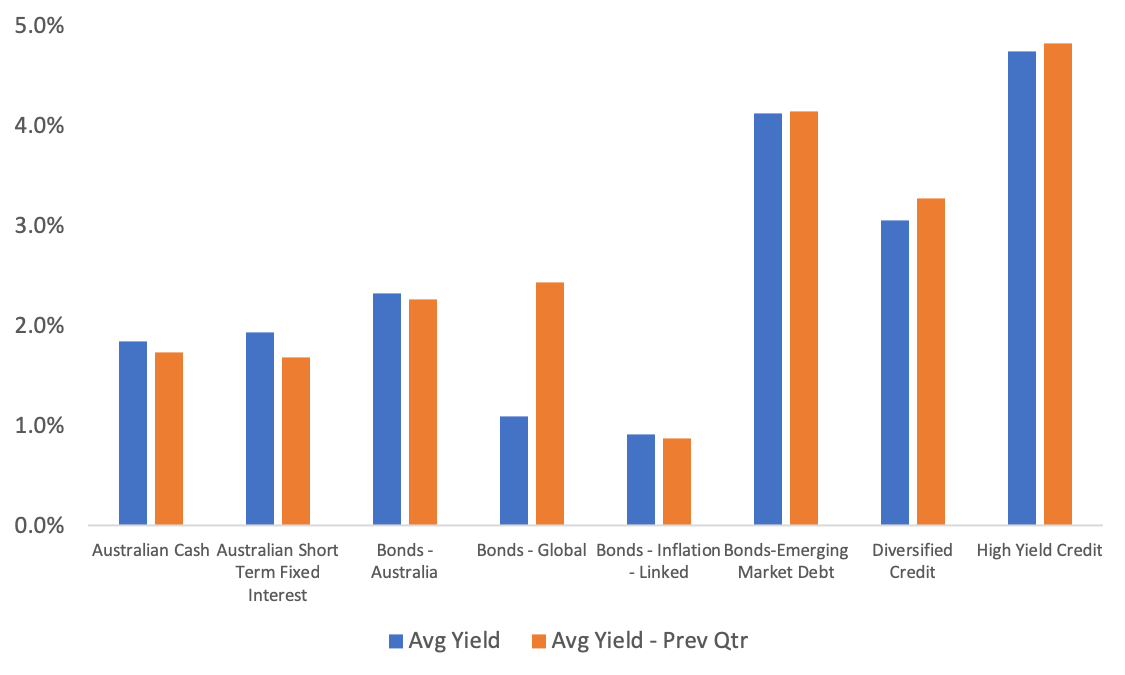
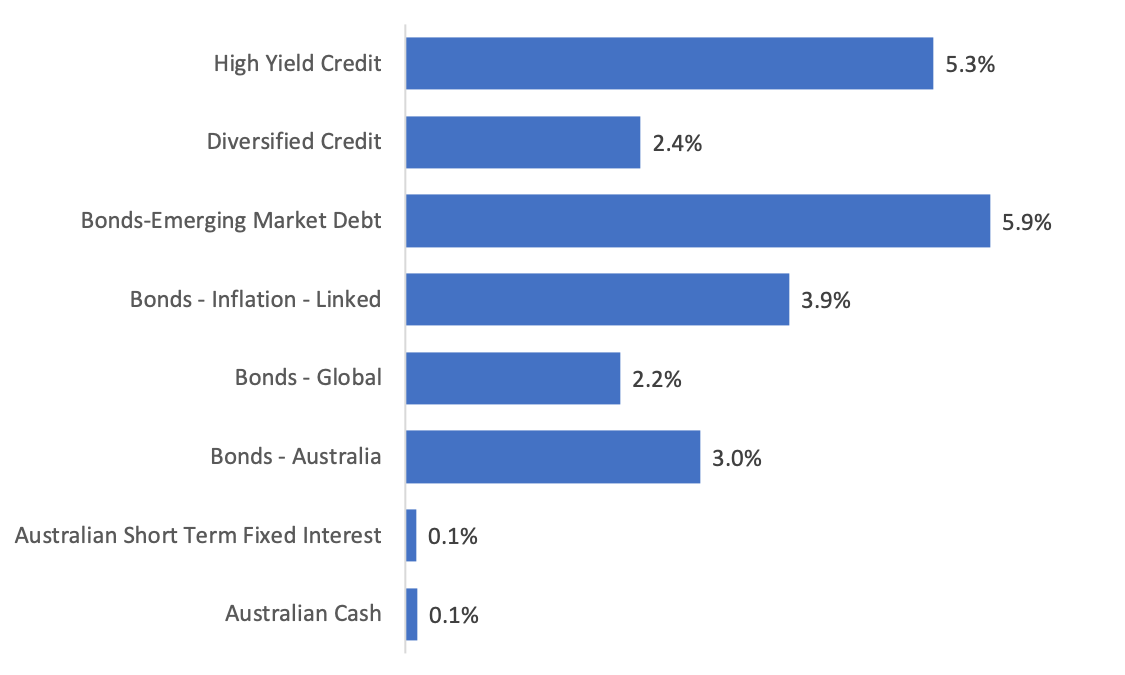
Securities Overview - Fixed Income & Cash
| Fixed Income & Cash | FUM ($m) | Qtr Flows ($m) | No. of Funds |
|---|---|---|---|
| $ 5,062.00 | $445.70 | 27 |
Source: ASX and Morningstar
Securities designed to provide investors access to domestic and global fixed income & cash markets. We hold positions in AAA, FLOT, QPON, VBND, IAF, VACF, VGB & IGB in our PMA Portfolios.
Global fixed income is facing longer-term weakness as the economic picture, particularly in the US, remains robust which will likely see higher cash rates in 2019. The prospect of higher interest rates from the US Federal Reserve will push yields higher and will cause bond capital to decline. Australian fixed income on the other hand remains stoic; the Reserve Bank currently has no plans to shift rates in either direction, while there are no foreseeable changes to Australia’s sovereign rating on the horizon. This is likely to make Australian fixed interest a stable capital investment for the income investors.
Source: ASX and Morningstar
| Figure 39: Funds Under Management ($m) | Figure 40: Geographic Exposure |
|---|---|
 |
 |
| Figure 41: Flows ($m) | |
 |
|
| Figure 42: Average Yield | |
 |
|
| Figure 43: Total Costs | |
 |
|
| Figure 44: Performance | |
 |
|
| Figure 45: Average Annual Volatility | |
 |
|
with the InvestSMART Hybrid Income Portfolio - Now with capped fees
Figure 46: Fixed Income and Cash ETFs
| Name | Total FUM | Qtr Flows ($M) | MER | Avg Spread | Avg Liquidity | 3MTH Return | 12MTH Return | Yield | Frequency | Structure | Sub Category | STAR Rating | |
|---|---|---|---|---|---|---|---|---|---|---|---|---|---|
| GLOBAL | |||||||||||||
| Corporate | |||||||||||||
| [IHCB] iShares Core Global Corporate Bond AUDH ETF | 88.23 | 7.31 | 0.26% | 0.27% | 7.30% | 0.90% | -0.07% | 2.76% | Tri-Annual | ETF | Diversified Credit | 3 | |
| [IHHY] iShares Global High Yield Bond AUDH ETF | 26.76 | 0.01 | 0.56% | 0.34% | 5.87% | 2.37% | 2.33% | 4.74% | Tri-Annual | ETF | High Yield Credit | 2 | |
| Diversified | |||||||||||||
| [IHEB] iShares JP Morgan USD Emerging Markets Bond AUDH ETF | 13.19 | 0.01 | 0.51% | 0.41% | 6.14% | 2.14% | -3.08% | 4.13% | Tri-Annual | ETF | Bonds-Emerging Market Debt | 2 | |
| [VCF] Vanguard International Credit Securities Index (Hedged) ETF | 100.44 | 2.66 | 0.30% | 0.21% | 7.01% | 0.54% | 0.44% | 3.82% | Quarterly | ETF | Diversified Credit | 3 | |
| [VBND] Vanguard Global Aggregate Bond Hedged ETF | 28.71 | 12.01 | 0.20% | 0.23% | 17.58% | -0.07% | 0.00% | 1.27% | Quarterly | ETF | Bonds - Global | 3 | |
| [VEFI] Vanguard Ethically Conscious Global Aggregate Bond Index (Hedged) ETF | 1.00 | 1.00 | 0.26% | 0.34% | 0.98% | 0.00% | 0.00% | 0.00% | Quarterly | ETF | Bonds - Global | 2 | |
| Government | |||||||||||||
| [VIF] Vanguard International Fixed Interest Index (Hedged) ETF | 217.50 | 24.64 | 0.20% | 0.16% | 7.63% | -0.51% | 1.08% | 1.99% | Quarterly | ETF | Bonds - Global | 4 | |
| AUSTRALIA | |||||||||||||
| Cash | |||||||||||||
| [AAA] BetaShares Australian High Interest Cash ETF | 1,229.91 | -80.81 | 0.18% | 0.02% | 16.56% | 0.33% | 1.85% | 2.02% | Monthly | ETF | Australian Cash | 5 | |
| [BILL] iShares Core Cash ETF | 282.36 | 85.29 | 0.07% | 0.01% | 17.01% | 0.34% | 1.69% | 1.78% | Monthly | ETF | Australian Cash | 5 | |
| [ISEC] iShares Enhanced Cash ETF | 65.28 | 29.13 | 0.12% | 0.01% | 19.69% | 0.39% | 1.87% | 1.93% | Monthly | ETF | Australian Short Term Fixed Interest | 4 | |
| [MONY] UBS IQ Cash ETF | 1.00 | 0.00 | 0.18% | 0.09% | 0.75% | 0.37% | 1.47% | 1.72% | Monthly | ETF | Australian Cash | 4 | |
| Corporate | |||||||||||||
| [PLUS] VanEck Vectors Australian Corp Bd ETF | 222.34 | 27.33 | 0.32% | 0.18% | 5.87% | 0.74% | 3.92% | 3.49% | Quarterly | ETF | Diversified Credit | 4 | |
| [RCB] Russell Investment Australian Select Corporate Bond ETF | 177.91 | 12.10 | 0.28% | 0.27% | 5.36% | 0.78% | 2.14% | 3.14% | Quarterly | ETF | Bonds - Australia | 3 | |
| [VACF] Vanguard Australian Corp Fixed Interest ETF | 150.97 | 24.31 | 0.26% | 0.14% | 8.08% | 0.77% | 3.75% | 2.47% | Quarterly | ETF | Bonds - Australia | 4 | |
| [FLOT] VanEck Vectors Australian Floating Return ETF | 136.45 | 51.24 | 0.22% | 0.08% | 18.28% | 0.50% | 2.14% | 2.35% | Monthly | ETF | Diversified Credit | 4 | |
| [QPON] Betashares Australian Bank Sr Floating Return Bond ETF | 296.82 | 59.36 | 0.22% | 0.05% | 12.21% | 0.70% | 2.26% | 2.55% | Monthly | ETF | Diversified Credit | 4 | |
| [CRED] BetaShares Australian Investment Geared Corporate Bond ETF | 62.10 | 58.30 | 0.25% | 0.14% | 58.14% | 0.34% | 0.00% | 1.22% | Monthly | ETF | Bonds - Australia | 4 | |
| Diversified | |||||||||||||
| [IAF] iShares Core Composite Bond ETF | 623.57 | 40.20 | 0.20% | 0.06% | 6.02% | 0.49% | 3.52% | 2.28% | Quarterly | ETF | Bonds - Australia | 4 | |
| [VAF] Vanguard Australian Fixed Interest ETF | 718.39 | 15.45 | 0.20% | 0.05% | 5.28% | 0.49% | 3.53% | 2.86% | Quarterly | ETF | Bonds - Australia | 4 | |
| Government | |||||||||||||
| [BOND] SPDR S&P/ASX Australian Bond ETF | 23.49 | 0.01 | 0.24% | 0.13% | 5.31% | 5.77% | 8.94% | 2.52% | Quarterly | ETF | Bonds - Australia | 3 | |
| [GOVT] SPDR S&P/ASX Australian Government Bond ETF | 12.96 | 0.00 | 0.22% | 0.14% | 8.16% | 0.40% | 3.56% | 2.13% | Quarterly | ETF | Bonds - Australia | 3 | |
| [IGB] iShares Treasury ETF | 35.96 | 5.16 | 0.26% | 0.10% | 17.93% | 0.39% | 3.61% | 2.15% | Quarterly | ETF | Bonds - Australia | 3 | |
| [ILB] iShares Government Inflation ETF | 117.21 | 1.17 | 0.26% | 0.15% | 5.84% | -0.57% | 4.07% | 0.92% | Quarterly | ETF | Bonds - Inflation - Linked | 3 | |
| [RGB] Russell Investment Australian Government Bond ETF | 60.39 | 0.00 | 0.24% | 0.25% | 1.52% | 0.43% | 2.97% | 2.00% | Quarterly | ETF | Bonds - Australia | 3 | |
| [RSM] Russell Investment Australian Semi-Government Bond ETF | 61.34 | 0.01 | 0.26% | 0.23% | 2.19% | 0.54% | 2.30% | 2.03% | Quarterly | ETF | Bonds - Australia | 3 | |
| [VGB] Vanguard Australian Government Bond ETF | 146.36 | 9.42 | 0.20% | 0.09% | 7.81% | 0.42% | 3.58% | 2.80% | Quarterly | ETF | Bonds - Australia | 4 | |
| Hybrids | |||||||||||||
| [HBRD] BetaShares Active Australian Hybrids Fund (managed fund) | 161.37 | 60.42 | 0.55% | 0.16% | 16.51% | 1.88% | 0.00% | 3.35% | Monthly | MF | Diversified Credit | NR | |
Source: ASX and Morningstar
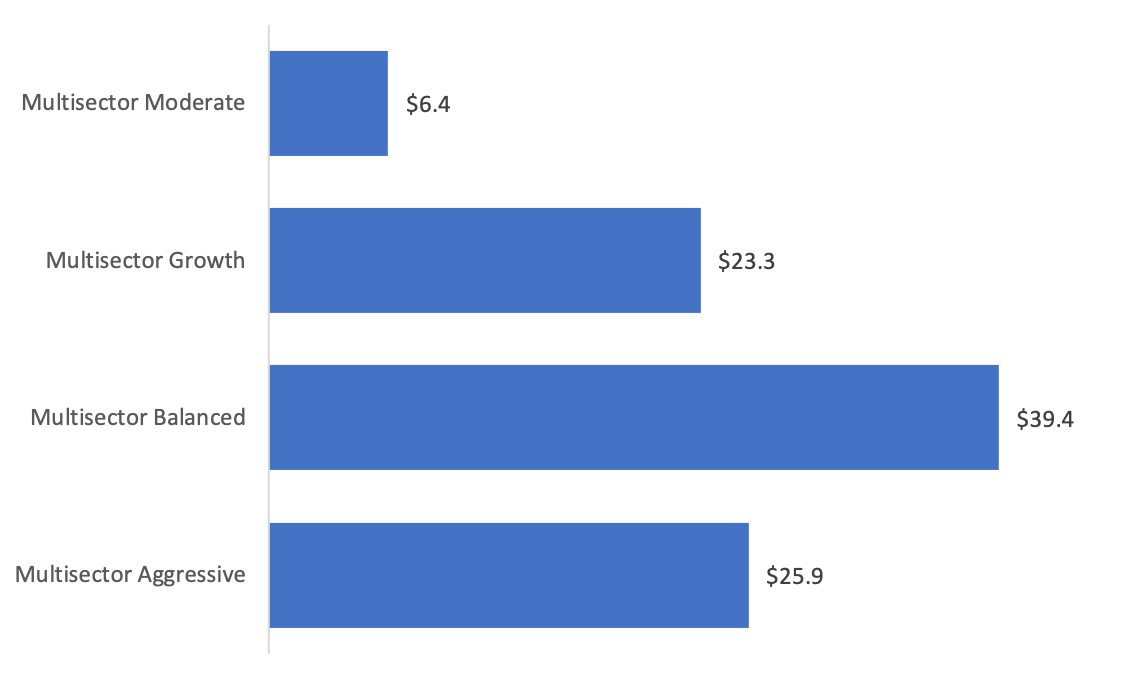
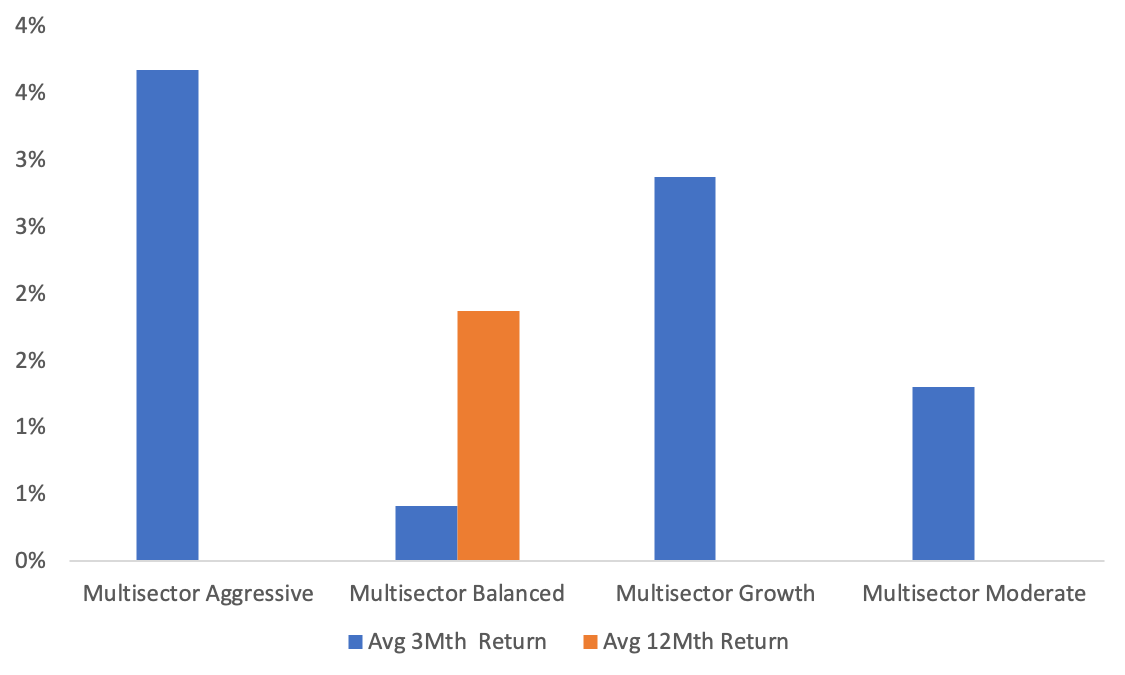
Securities Overview - Diversified
| Diversified | FUM ($m) | Qtr Flows ($m) | No. of Funds |
|---|---|---|---|
| $ 305.00 | $95.00 | 6 |
Source: ASX and Morningstar
Securities designed to provide investors with diversified multi sector asset allocation. We manage a range of diversified PMA Portfolios.
| Figure 47: Funds Under Management ($m) | Figure 48: Geographic Exposure |
|---|---|
 |
 |
| Figure 49: Flows ($m) | |
 |
|
| Figure 50: Average Yield | |
 |
|
| Figure 51: Total Costs | |
 |
|
| Figure 52: Performance | |
 |
|
| Figure 53: Average Annual Volatility | |
 |
|
with the InvestSMART diversified portfolios - Now with capped fees
Figure 54: Diversified ETFs
| Name | Total FUM | Qtr Flows ($M) | MER | Avg Spread | Avg Liquidity | 3MTH Return | 12MTH Return | Yield | Frequency | Structure | Sub Category | STAR Rating | |
|---|---|---|---|---|---|---|---|---|---|---|---|---|---|
| GLOBAL | |||||||||||||
| Balanced | |||||||||||||
| [DMKT] AMP Capital - Dynamic Markets ETF (Hedge) | 30.98 | 3.16 | 0.50% | 0.69% | 4.87% | -2.38% | 0.63% | 2.90% | Semi-Annual | MF | Multisector Balanced | NR | |
| [GROW] Schroder Real Return ETF | 56.90 | 9.81 | 0.90% | 0.51% | 7.11% | 1.55% | 4.99% | 3.40% | Semi-Annual | MF | Multisector Balanced | NR | |
| [VDBA] Vanguard Diversified Balanced ETF | 50.67 | 26.43 | 0.27% | 0.20% | 23.78% | 2.07% | 0.00% | 1.16% | Quarterly | ETF | Multisector Balanced | 3 | |
| Conservative | |||||||||||||
| [VDCO] Vanguard Diversified Conservative ETF | 16.20 | 6.43 | 0.27% | 0.23% | 14.92% | 1.30% | 0.00% | 1.01% | Quarterly | ETF | Multisector Moderate | 2 | |
| High Growth | |||||||||||||
| [VDHG] Vanguard Diversified High Growth ETF | 93.02 | 25.89 | 0.27% | 0.17% | 12.86% | 3.67% | 0.00% | 2.23% | Quarterly | ETF | Multisector Aggressive | 3 | |
| Growth | |||||||||||||
| [VDGR] Vanguard Diversified Growth ETF | 57.52 | 23.28 | 0.27% | 0.19% | 17.78% | 2.87% | 0.00% | 1.90% | Quarterly | ETF | Multisector Growth | 3 | |
Source: ASX and Morningstar
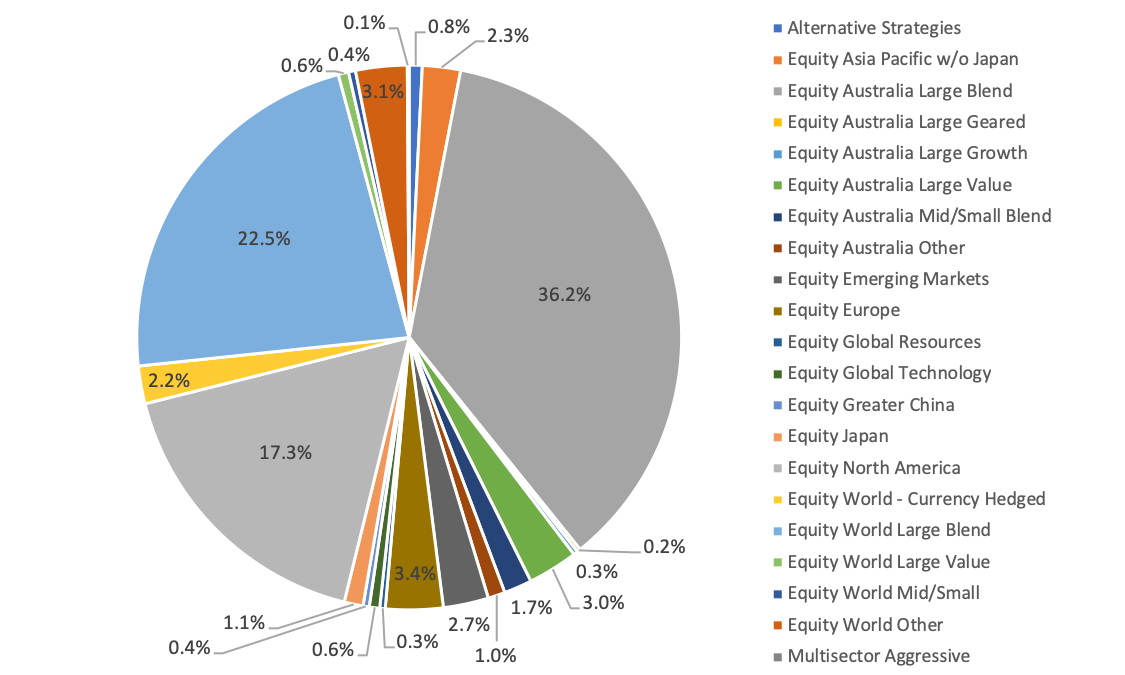
Securities Overview - Equities
| Equities | FUM ($m) | Qtr Flows ($m) | No. of Funds |
|---|---|---|---|
| $ 32,712.00 | $ 1,187.60 | 123 |
Source: ASX and Morningstar
This group of securities provides the investor with broad-based as well as specific sector exposure across domestic and international equity markets. We hold positions in IAA, IVV, VEQ, UMAX, VGS & IOZ in our PMA Portfolios.
The US equity markets just had its best quarter since 2013 and saw IVV for example adding over 10% in the September quarter as it also benefited from the falling AUD. Looking ahead, US equity markets have begun to find sellers and the fact Value is becoming more attractive may see rotations to differing equity markets in the coming year. For example: Asian equities which have fallen over 30% in the past six months and sectors with a value thematic such as staples are likely to see rotation flows as markets reposition into 2019.
Source: ASX and Morningstar| Figure 55: Funds Under Management ($m) | |
|---|---|
 |
|
| Figure 56: Geographic Exposure | |
 |
|
| Figure 57: Flows ($m) | |
 |
|
| Figure 58: Average Yield | |
 |
|
| Figure 59: Total Costs | |
 |
|
| Figure 60: Performance | |
 |
|
| Figure 61: Average Annual Volatility | |
 |
|
Invest in the InvestSMART International Equities Portfolio - Now with capped fees
Figure 62: Equity ETFs Europe
| Name | Total FUM | Qtr Flows ($M) | MER | Avg Spread | Avg Liquidity | 3MTH Return | 12MTH Return | Yield | Frequency | Structure | Sub Category | STAR Rating | |
|---|---|---|---|---|---|---|---|---|---|---|---|---|---|
| EUROPE | |||||||||||||
| Equities - Broad | |||||||||||||
| [ESTX] ETFS EURO STOXX 50 ETF | 64.34 | -3.82 | 0.35% | 0.17% | 9.02% | 1.89% | 3.57% | 3.57% | Semi-Annual | ETF | Equity Europe | 3 | |
| [HEUR] BetaShares WisdomTree Europe ETF - Currency Hedged | 45.91 | -2.48 | 0.58% | 0.19% | 11.42% | 0.00% | -0.17% | 4.07% | Semi-Annual | ETF | Equity Europe | 3 | |
| [IEU] iShares Europe ETF (AU) | 776.71 | -21.19 | 0.60% | 0.11% | 4.97% | 2.53% | 7.44% | 2.43% | Semi-Annual | ETF | Equity Europe | 4 | |
| [VEQ] Vanguard FTSE Europe Shares ETF | 217.45 | 16.96 | 0.35% | 0.13% | 7.29% | 2.55% | 7.28% | 2.50% | Quarterly | ETF | Equity Europe | 4 | |
| Equities - Strategy | |||||||||||||
| [UBE] UBS IQ MSCI Europe Ethical ETF | 11.64 | 0.02 | 0.40% | 0.32% | 3.70% | 2.98% | 8.39% | 2.58% | Annual | ETF | Equity Europe | 2 | |
Source: ASX and Morningstar
Figure 63: Equity ETFs Emerging Markets
| Name | Total FUM | Qtr Flows ($M) | MER | Avg Spread | Avg Liquidity | 3MTH Return | 12MTH Return | Yield | Frequency | Structure | Sub Category | STAR Rating | |
|---|---|---|---|---|---|---|---|---|---|---|---|---|---|
| EMERGING MARKETS | |||||||||||||
| Equities - Broad | |||||||||||||
| [IEM] iShares MSCI Emerging Markets ETF (AU) | 618.42 | -9.33 | 0.69% | 0.13% | 9.07% | 0.93% | 7.00% | 1.80% | Semi-Annual | ETF | Equity Emerging Markets | 4 | |
| [VGE] Vanguard FTSE Emerging Markets Shares ETF | 233.30 | 26.06 | 0.48% | 0.20% | 11.77% | 0.10% | 3.84% | 1.73% | Quarterly | ETF | Equity Emerging Markets | 3 | |
| [WEMG] SPDR S&P Emerging Markets ETF | 19.05 | -1.00 | 0.65% | 0.26% | 21.50% | 1.50% | 7.84% | 2.44% | Annual | ETF | Equity Emerging Markets | 2 | |
| Equities - Strategy | |||||||||||||
| [EMKT] VanEck Vectors MSCI Mltfac Emerging Markets Equities ETF | 7.46 | -7.46 | 0.69% | 0.53% | 21.18% | -3.92% | 0.00% | 0.48% | Annual | ETF | Equity Emerging Markets | 2 | |
Source: ASX and Morningstar
Figure 64: Equity ETFs USA
| Name | Total FUM | Qtr Flows ($M) | MER | Avg Spread | Avg Liquidity | 3MTH Return | 12MTH Return | Yield | Frequency | Structure | Sub Category | STAR Rating | |
|---|---|---|---|---|---|---|---|---|---|---|---|---|---|
| USA | |||||||||||||
| Equities - Broad | |||||||||||||
| [IJH] iShares S&P Mid - Capital ETF | 157.22 | 5.08 | 0.07% | 0.15% | 10.73% | 6.00% | 23.78% | 0.81% | Quarterly | ETF | Equity North America | 4 | |
| [IJR] iShares S&P Small - Capital ETF | 190.11 | 14.03 | 0.07% | 0.50% | 6.97% | 7.03% | 29.25% | 0.68% | Quarterly | ETF | Equity North America | 3 | |
| [IVV] iShares S&P 500 ETF | 3,016.49 | -2.09 | 0.04% | 0.08% | 3.98% | 9.97% | 27.82% | 1.02% | Quarterly | ETF | Equity North America | 5 | |
| [NDQ] BetaShares NASDAQ 100 ETF | 438.07 | 59.87 | 0.48% | 0.09% | 11.65% | 10.74% | 38.91% | 0.44% | Semi-Annual | ETF | Equity North America | 4 | |
| [QUS] BetaShares FTSE RAFI US 1000 ETF | 43.64 | 0.06 | 0.40% | 0.18% | 6.00% | 8.25% | 21.82% | 2.88% | Semi-Annual | ETF | Equity North America | 3 | |
| [SPY] SPDR S&P 500 ETF | 24.95 | 1.00 | 0.09% | 0.19% | 6.52% | 9.93% | 27.69% | 1.41% | Quarterly | ETF | Equity North America | 3 | |
| [VTS] Vanguard US Total Market Shares ETF | 1,496.42 | 29.95 | 0.04% | 0.07% | 4.07% | 8.84% | 26.95% | 0.98% | Quarterly | ETF | Equity North America | 5 | |
| Equities - Strategy | |||||||||||||
| [GGUS] BetaShares Geared US Equities - Currency Hedged | 18.94 | -1.86 | 0.80% | 0.13% | 41.62% | 18.06% | 35.54% | 0.63% | Annual | MF | Equity World - Currency Hedged | NR | |
| [IHVV] iShares S&P 500 AUD Hedged ETF | 140.01 | 26.47 | 0.10% | 0.15% | 14.66% | 7.61% | 17.18% | 2.73% | Annual | ETF | Equity North America | 4 | |
| [UBU] UBS IQ MSCI USA Ethical ETF | 7.43 | 0.01 | 0.20% | 0.21% | 2.54% | 9.59% | 27.47% | 1.90% | Annual | ETF | Equity North America | 2 | |
| [UMAX] BetaShares S&P 500 Yield Maximiser | 97.53 | -3.01 | 0.79% | 0.17% | 3.64% | 9.03% | 21.12% | 4.37% | Quarterly | MF | Equity World Other | NR | |
| [ZYUS] ETFS S&P 500 High Yield Low Volatil ETF | 56.23 | 3.34 | 0.35% | 0.19% | 7.17% | 3.97% | 13.03% | 5.52% | Quarterly | ETF | Equity North America | 3 | |
| [BBUS] BetaShares US Equities Strong Bear Hedged - Currency Hedged | 69.97 | 20.53 | 1.38% | 0.26% | 33.92% | -15.31% | -32.86% | 0.00% | Annual | MF | Alternative Strategies | NR | |
Source: ASX and Morningstar
Figure 65: Equity ETFs Asia
| Name | Total FUM | Qtr Flows ($M) | MER | Avg Spread | Avg Liquidity | 3MTH Return | 12MTH Return | Yield | Frequency | Structure | Sub Category | STAR Rating | |
|---|---|---|---|---|---|---|---|---|---|---|---|---|---|
| ASIA. | |||||||||||||
| Equities - Broad | |||||||||||||
| [CETF] Market Vectors ChinaAMC A - Share ETF (Syn) | 15.93 | 6.06 | 0.72% | 0.58% | 23.00% | -2.49% | -6.04% | 1.04% | Annual | ETF | Equity Greater China | 1 | |
| [HJPN] BetaShares WisdomTree Japan ETF - Currency Hedged | 63.73 | -2.41 | 0.58% | 0.22% | 15.73% | 7.16% | 8.14% | 2.69% | Semi-Annual | ETF | Equity Japan | 3 | |
| [IAA] iShares Asia 50 ETF (AU) | 485.06 | 40.84 | 0.50% | 0.31% | 8.04% | 1.22% | 13.32% | 1.37% | Semi-Annual | ETF | Equity Asia Pacific w/o Japan | 3 | |
| [IJP] iShares MSCI Japan ETF (AU) | 297.89 | 19.09 | 0.48% | 0.16% | 8.57% | 5.81% | 19.11% | 1.14% | Semi-Annual | ETF | Equity Japan | 4 | |
| [IKO] iShares MSCI South Korea ETF (AU) | 64.91 | 21.71 | 0.64% | 0.49% | 14.25% | 2.70% | 10.64% | 2.46% | Annual | ETF | Equity World Other | 2 | |
| [ITW] iShares MSCI Taiwan ETF | 50.71 | -0.80 | 0.64% | 0.78% | 1.06% | 7.23% | 17.26% | 2.11% | Annual | ETF | Equity World Other | 2 | |
| [IZZ] iShares China Large - Capital ETF (AU) | 104.45 | 4.86 | 0.74% | 0.38% | 18.13% | 1.14% | 9.84% | 2.73% | Semi-Annual | ETF | Equity Greater China | 3 | |
| [VAE] Vanguard FTSE Asia ex Japan Shares Index ETF | 112.35 | 14.83 | 0.40% | 0.23% | 10.11% | 0.77% | 9.82% | 2.73% | Quarterly | ETF | Equity Asia Pacific w/o Japan | 3 | |
| [PAXX] Platinum Asia (Quoted Managed Hedged) | 132.46 | 43.72 | 1.10% | 0.39% | 14.68% | -2.68% | 5.16% | 24.88% | Annual | MF | Equity Asia Pacific w/o Japan | NR | |
| Equities - Strategy | |||||||||||||
| [UBJ] UBS IQ MSCI Japan Ethical ETF | 4.84 | 0.01 | 0.40% | 0.22% | 5.09% | 5.80% | 19.28% | 1.74% | Annual | ETF | Equity Japan | 2 | |
| [UBP] UBS IQ MSCI Asia APEX 50 Ethical ETF | 11.05 | 2.06 | 0.45% | 0.32% | 12.22% | -0.10% | 9.69% | 1.02% | Annual | ETF | Equity Asia Pacific w/o Japan | 2 | |
| [ASIA] BetaShares Asia Technology Tigers ETF | 7.34 | 7.34 | 0.67% | 0.27% | 90.45% | 0.00% | 0.00% | 0.00% | Annual | ETF | Equity World Other | 1 | |
Source: ASX and Morningstar
Figure 66: Equity ETFs Australia
| Name | Total FUM | Qtr Flows ($M) | MER | Avg Spread | Avg Liquidity | 3MTH Return | 12MTH Return | Yield | Frequency | Structure | Sub Category | STAR Rating | |
|---|---|---|---|---|---|---|---|---|---|---|---|---|---|
| AUSTRALIA | |||||||||||||
| Equities - Broad | |||||||||||||
| [EX20] BetaShares Australian ex-20 Portfolio Diversified ETF | 89.70 | 54.23 | 0.25% | 0.16% | 26.13% | 1.54% | 16.14% | 4.35% | Semi-Annual | ETF | Equity Australia Large Blend | 3 | |
| [ILC] iShares S&P/ASX 20 ETF | 306.20 | -16.72 | 0.24% | 0.11% | 3.92% | 1.46% | 12.31% | 4.45% | Quarterly | ETF | Equity Australia Large Blend | 4 | |
| [IOZ] iShares Core S&P/ASX 200 ETF | 1,210.82 | 37.42 | 0.15% | 0.06% | 5.46% | 1.49% | 13.74% | 3.66% | Quarterly | ETF | Equity Australia Large Blend | 5 | |
| [ISO] iShares S&P/ASX Small Ordinaries ETF | 116.78 | 11.13 | 0.55% | 0.29% | 7.96% | 0.95% | 19.44% | 1.86% | Semi-Annual | ETF | Equity Australia Mid/Small Blend | 3 | |
| [MVE] VanEck Vectors S&P/ASX MidCap ETF | 100.01 | 8.77 | 0.45% | 0.15% | 7.05% | 3.44% | 16.77% | 2.23% | Semi-Annual | ETF | Equity Australia Mid/Small Blend | 3 | |
| [MVS] VanEck Vectors Small Companies Masters ETF | 61.09 | -7.36 | 0.49% | 0.18% | 10.12% | -1.60% | 15.67% | 3.24% | Semi-Annual | ETF | Equity Australia Mid/Small Blend | 3 | |
| [MVW] VanEck Vectors Australian Equal Wt ETF | 623.68 | 86.39 | 0.35% | 0.08% | 8.69% | 3.21% | 15.98% | 2.63% | Semi-Annual | ETF | Equity Australia Large Blend | 4 | |
| [QOZ] BetaShares FTSE RAFI Australia 200 ETF | 213.76 | -66.53 | 0.40% | 0.11% | 19.46% | 1.08% | 11.33% | 6.09% | Semi-Annual | ETF | Equity Australia Large Blend | 4 | |
| [SFY] SPDR S&P/ASX 50 ETF | 519.17 | 6.20 | 0.29% | 0.06% | 3.52% | 1.16% | 12.07% | 4.59% | Quarterly | ETF | Equity Australia Large Blend | 4 | |
| [SSO] SPDR S&P/ASX Small Ordinaries ETF | 23.35 | 1.58 | 0.50% | 0.20% | 5.59% | 0.64% | 19.28% | 2.15% | Semi-Annual | ETF | Equity Australia Mid/Small Blend | 2 | |
| [STW] SPDR S&P/ASX 200 ETF | 3,623.93 | -171.03 | 0.19% | 0.04% | 8.09% | 1.50% | 13.73% | 4.06% | Quarterly | ETF | Equity Australia Large Blend | 5 | |
| [VAS] Vanguard Australian Shares ETF | 2,990.26 | 147.68 | 0.14% | 0.04% | 7.38% | 1.45% | 13.84% | 4.36% | Quarterly | ETF | Equity Australia Large Blend | 5 | |
| [VLC] Vanguard MSCI Australian Large Companies ETF | 83.84 | 0.02 | 0.20% | 0.07% | 2.63% | 1.18% | 11.31% | 4.33% | Quarterly | ETF | Equity Australia Large Blend | 4 | |
| [VSO] Vanguard MSCI Australian Small Companies ETF | 216.98 | 26.86 | 0.30% | 0.13% | 7.35% | 1.34% | 18.10% | 1.92% | Semi-Annual | ETF | Equity Australia Mid/Small Blend | 4 | |
| [ZOZI] ETFS S&P/ASX 100 ETF | 9.47 | 0.01 | 0.24% | 0.16% | 2.13% | 1.46% | 12.92% | 4.07% | Quarterly | ETF | Equity Australia Large Blend | 3 | |
| [A200] BetaShares Australia 200 ETF | 172.11 | 123.68 | 0.07% | 0.04% | 51.11% | 1.59% | 0.00% | 1.27% | Quarterly | ETF | Equity Australia Large Blend | 5 | |
| Equities - Sector | |||||||||||||
| [MVB] VanEck Vectors Australian Banks ETF | 39.25 | 4.49 | 0.28% | 0.11% | 9.50% | -2.07% | 1.40% | 5.04% | Tri-Annual | ETF | Equity Australia Other | 3 | |
| [MVR] VanEck Vectors Australian Resources ETF | 59.17 | -36.90 | 0.35% | 0.17% | 38.41% | -0.23% | 24.58% | 2.23% | Semi-Annual | ETF | Equity Australia Other | 3 | |
| [OZF] SPDR S&P/ASX 200 Financials EX A-REIT ETF | 66.66 | 4.07 | 0.40% | 0.11% | 6.73% | -0.34% | 0.88% | 4.75% | Semi-Annual | ETF | Equity Australia Other | 4 | |
| [OZR] SPDR S&P/ASX 200 Resources ETF | 76.12 | 2.25 | 0.40% | 0.18% | 10.10% | 0.58% | 28.90% | 2.15% | Semi-Annual | ETF | Equity Australia Other | 3 | |
| [QFN] BetaShares S&P/ASX200 Financials Sect ETF | 21.95 | 0.03 | 0.39% | 0.14% | 32.31% | -0.31% | 0.85% | 4.27% | Semi-Annual | ETF | Equity Australia Other | 3 | |
| [QRE] BetaShares S&P/ASX200 Res Sect ETF | 69.70 | -78.61 | 0.39% | 0.22% | 55.46% | 0.70% | 29.28% | 1.15% | Semi-Annual | ETF | Equity Australia Other | 3 | |
| Equities - Strategy | |||||||||||||
| [AUMF] iShares Edge MSCI Australia Multifactor ETF | 12.71 | 3.49 | 0.30% | 0.46% | 11.63% | 1.11% | 14.10% | 7.41% | Semi-Annual | ETF | Equity Australia Large Blend | 2 | |
| [AUST] BetaShares Managed Risk Australian Share | 28.21 | 6.61 | 0.49% | 0.17% | 13.61% | 1.23% | 11.32% | 4.44% | Semi-Annual | MF | Equity Australia Large Blend | NR | |
| [BBOZ] BetaShares Australian Equities Strong BearHdg | 88.57 | 1.22 | 1.38% | 0.14% | 29.49% | -1.95% | -23.90% | 0.00% | Annual | MF | Alternative Strategies | NR | |
| [BEAR] BetaShares Australian Equities Bear Hedge | 52.67 | 2.02 | 1.38% | 0.13% | 20.33% | -0.73% | -10.50% | 0.00% | Annual | MF | Alternative Strategies | NR | |
| [DIV] UBS IQ Morningstar Australia Diversified Yield ETF | 10.15 | -0.97 | 0.30% | 0.22% | 3.65% | 1.24% | 8.19% | 5.07% | Quarterly | ETF | Equity Australia Large Growth | 3 | |
| [ETF] UBS IQ Morningstar Australia Quality ETF | 8.62 | 0.03 | 0.30% | 0.18% | 3.40% | 2.45% | 9.09% | 3.09% | Semi-Annual | ETF | Equity Australia Large Blend | 3 | |
| [FDIV] VanEck Vectors S&P/ASX Franked Diversified ETF | 3.96 | 0.00 | 0.35% | 0.16% | 9.20% | 1.96% | 11.14% | 5.60% | Quarterly | ETF | Equity Australia Large Blend | 3 | |
| [GEAR] BetaShares Geared Australian Equity (Hedged) | 67.96 | -6.96 | 0.80% | 0.18% | 15.85% | 1.30% | 24.94% | 6.70% | Semi-Annual | MF | Equity Australia Large Geared | NR | |
| [IHD] iShares S&P/ASX Dividend Opportunities ETF | 238.51 | -12.15 | 0.30% | 0.15% | 4.25% | -1.45% | 4.90% | 5.12% | Quarterly | ETF | Equity Australia Large Value | 4 | |
| [MVOL] iShares Edge MSCI Australia Mini Volume ETF | 2.20 | 0.01 | 0.30% | 0.15% | 15.41% | 0.69% | 11.94% | 7.38% | Semi-Annual | ETF | Equity Australia Large Blend | 3 | |
| [RARI] Russell Investment Australian Responsible Investment ETF | 80.05 | 8.75 | 0.45% | 0.32% | 4.51% | 1.34% | 9.83% | 5.86% | Semi-Annual | ETF | Equity Australia Large Value | 3 | |
| [RDV] Russell Investment High Dividend Australian Shares ETF | 280.07 | 0.86 | 0.34% | 0.13% | 2.65% | 1.61% | 2.75% | 6.77% | Quarterly | ETF | Equity Australia Large Value | 4 | |
| [SMLL] BetaShares Australian Small Companies Select | 24.59 | 3.09 | 0.39% | 0.48% | 5.52% | -0.43% | 14.14% | 4.90% | Semi-Annual | MF | Equity Australia Mid/Small Blend | NR | |
| [SWTZ] Switzer Dividend Growth | 74.11 | -2.49 | 0.89% | 0.60% | 3.08% | 0.81% | 7.95% | 6.02% | Quarterly | MF | Equity Australia Large Growth | NR | |
| [SYI] SPDR MSCI Australia Select High Diversified Yield ETF | 151.00 | -8.80 | 0.35% | 0.09% | 5.25% | 0.14% | 5.39% | 5.92% | Quarterly | ETF | Equity Australia Large Value | 4 | |
| [UBA] UBS IQ MSCI Australia Ethical ETF | 194.72 | -12.19 | 0.17% | 0.13% | 2.89% | 1.14% | 13.23% | 3.92% | Semi-Annual | ETF | Equity Australia Large Blend | 4 | |
| [VHY] Vanguard Australian Shares High Yield ETF | 1,078.80 | 0.68 | 0.25% | 0.08% | 4.83% | 3.18% | 4.66% | 8.07% | Quarterly | ETF | Equity Australia Large Blend | 4 | |
| [YMAX] BetaShares Australian Top 20 Equities Yield Maxmsr | 365.19 | -9.59 | 0.79% | 0.21% | 4.27% | 1.14% | 8.62% | 8.45% | Quarterly | MF | Equity Australia Large Blend | NR | |
| [ZYAU] ETFS S&P/ASX 300 High Yield Plus ETF | 75.47 | 13.60 | 0.35% | 0.17% | 10.91% | -0.64% | 6.04% | 5.78% | Quarterly | ETF | Equity Australia Large Blend | 3 | |
| [HVST] BetaShares Australian Diversified Harvester (mgd) | 181.76 | -14.01 | 0.90% | 0.12% | 7.39% | -0.49% | 0.63% | 10.44% | Monthly | MF | Equity Australia Large Value | NR | |
| [KSM] K2 Australian Small Capital Fund | 26.36 | 11.66 | 2.70% | 1.24% | 16.25% | 2.88% | 5.43% | 6.81% | Annual | MF | Alternative Strategies | NR | |
| [FAIR] BetaShares Australian Sustnby Leaders ETF | 178.88 | 9.85 | 0.49% | 0.14% | 6.11% | 3.91% | 0.00% | 1.15% | Semi-Annual | ETF | Equity Australia Large Blend | 4 | |
| [EINC] BetaShares Legg Mason Equity Income Fund | 18.09 | 5.27 | 0.85% | 0.35% | 12.25% | 0.46% | 0.00% | 2.03% | Quarterly | MF | Equity Australia Large Value | NR | |
| [EIGA] eInvest Income Generator ETF | 21.36 | 3.64 | 0.80% | 0.59% | 7.82% | 0.00% | 0.00% | 1.21% | 0 | MF | Equity Australia Large Value | NR | |
| [INIF] InvestSMART Australian Equity Income ETF | 36.84 | 2.88 | 1.24% | 0.56% | 4.62% | -0.37% | 0.00% | 0.00% | Semi-Annual | MF | Equity Australia Large Blend | NR | |
Source: ASX and Morningstar
Figure 67: Equity ETFs Global
| Name | Total FUM | Qtr Flows ($M) | MER | Avg Spread | Avg Liquidity | 3MTH Return | 12MTH Return | Yield | Frequency | Structure | Sub Category | STAR Rating | |
|---|---|---|---|---|---|---|---|---|---|---|---|---|---|
| GLOBAL | |||||||||||||
| Equities - Broad | |||||||||||||
| [IHOO] iShares Global 100 AUD Hedged ETF | 37.35 | 0.34 | 0.43% | 0.39% | 5.05% | 7.11% | 14.54% | 7.30% | Annual | ETF | Equity World - Currency Hedged | 2 | |
| [IHWL] iShares Core MSCI World All Capital AUDH ETF | 58.14 | 45.68 | 0.19% | 0.41% | 29.73% | 5.23% | 12.67% | 2.01% | Semi-Annual | ETF | Equity World - Currency Hedged | 3 | |
| [IOO] iShares Global 100 ETF (AU) | 1,557.95 | 14.81 | 0.40% | 0.15% | 2.63% | 8.73% | 22.78% | 1.71% | Semi-Annual | ETF | Equity World Large Blend | 3 | |
| [IVE] iShares MSCI EAFE ETF (AU) | 343.70 | -1.68 | 0.33% | 0.20% | 5.65% | 3.47% | 11.36% | 2.46% | Semi-Annual | ETF | Equity World Large Blend | 4 | |
| [IWLD] iShares Core MSCI World All Capital ETF | 49.50 | 18.39 | 0.16% | 0.34% | 14.15% | 6.80% | 20.45% | 2.20% | Semi-Annual | ETF | Equity World Large Blend | 3 | |
| [KII] K2 Global Equities Fund (Hedge Fund) | 15.59 | -1.84 | 2.70% | 1.36% | 4.01% | 0.73% | 4.96% | 0.00% | Quarterly | MF | Alternative Strategies | NR | |
| [MGE] Magellan Global Equities | 1,198.67 | 45.71 | 1.35% | 0.34% | 3.96% | 8.93% | 25.43% | 2.80% | Annual | MF | Equity World Large Blend | NR | |
| [MHG] Magellan Global Equities Currency Hedged | 74.13 | 2.27 | 1.35% | 0.49% | 3.45% | 6.88% | 16.25% | 3.75% | Annual | MF | Equity World - Currency Hedged | NR | |
| [QUAL] VanEck Vectors MSCI World ex Australian Qlty ETF | 462.15 | 49.23 | 0.40% | 0.16% | 6.50% | 9.24% | 26.38% | 1.63% | Annual | ETF | Equity World Large Blend | 4 | |
| [UBW] UBS IQ MSCI World ex Australia Ethical ETF | 32.96 | 1.42 | 0.35% | 0.21% | 4.52% | 7.31% | 20.83% | 1.91% | Annual | ETF | Equity World Large Blend | 3 | |
| [VEU] Vanguard All - World ex-US Shares ETF | 1,352.70 | 59.06 | 0.11% | 0.12% | 4.40% | 3.04% | 10.28% | 2.31% | Quarterly | ETF | Equity World Large Blend | 5 | |
| [VGAD] Vanguard MSCI Index International (Hedged) ETF | 449.95 | 18.18 | 0.21% | 0.08% | 6.79% | 5.61% | 12.85% | 1.92% | Semi-Annual | ETF | Equity World - Currency Hedged | 4 | |
| [VGS] Vanguard MSCI Index International ETF | 1,290.63 | 116.87 | 0.18% | 0.07% | 6.92% | 7.35% | 20.84% | 2.33% | Quarterly | ETF | Equity World Large Blend | 4 | |
| [WXHG] SPDR S&P World ex Australia (Hedged) ETF | 88.33 | 1.24 | 0.35% | 0.18% | 3.23% | 5.45% | 12.37% | 2.19% | Annual | ETF | Equity World - Currency Hedged | 3 | |
| [WXOZ] SPDR S&P World ex Australia ETF | 186.06 | 1.64 | 0.30% | 0.15% | 1.53% | 7.21% | 20.45% | 2.25% | Annual | ETF | Equity World Large Blend | 3 | |
| [PIXX] Platinum International (Quoted Managed Hedged) | 290.63 | 79.34 | 1.10% | 0.31% | 11.27% | -0.29% | 6.59% | 13.24% | Annual | MF | Equity World Large Blend | NR | |
| Equities - Sector | |||||||||||||
| [BNKS] BetaShares Global Banks ETF - Currency Hedged | 75.34 | 2.86 | 0.57% | 0.27% | 7.84% | 2.07% | -0.11% | 3.81% | Semi-Annual | ETF | Equity World Other | 2 | |
| [DRUG] BetaShares Global Healthcare ETF - Currency Hedged | 29.34 | 2.42 | 0.57% | 0.29% | 6.42% | 12.44% | 15.10% | 3.29% | Semi-Annual | ETF | Equity World Other | 2 | |
| [FOOD] BetaShares Global Agriculture Companies ETF - Currency Hedged | 20.13 | 2.41 | 0.57% | 0.36% | 9.82% | 5.24% | 4.38% | 3.28% | Semi-Annual | ETF | Equity World Other | 2 | |
| [FUEL] BetaShares Global Energy Companies ETF - Currency Hedged | 35.89 | 6.60 | 0.57% | 0.29% | 11.55% | 1.81% | 18.65% | 2.16% | Semi-Annual | ETF | Equity Global Resources | 2 | |
| [GDX] Market Vectors Gold Miners ETF | 64.57 | 5.65 | 0.53% | 0.32% | 7.45% | -15.09% | -11.91% | 0.75% | Annual | ETF | Equity Global Resources | 2 | |
| [HACK] Betashares Global Cybersecurity ETF | 126.04 | 32.60 | 0.67% | 0.20% | 15.35% | 10.49% | 41.22% | 4.33% | Semi-Annual | ETF | Equity Global Technology | 3 | |
| [IXI] iShares Global Consumer Staples ETF (AU) | 107.32 | -5.10 | 0.47% | 0.30% | 3.04% | 4.63% | 9.60% | 1.94% | Semi-Annual | ETF | Equity World Other | 3 | |
| [IXJ] iShares Global Healthcare ETF (AU) | 546.69 | -18.95 | 0.47% | 0.20% | 5.24% | 13.93% | 23.41% | 1.08% | Semi-Annual | ETF | Equity World Other | 3 | |
| [MNRS] BetaShares Global Gold Miners ETF - Currency Hedged | 4.80 | 0.69 | 0.57% | 0.72% | 11.39% | -17.99% | -21.04% | 0.00% | Semi-Annual | ETF | Equity Global Resources | 1 | |
| [ROBO] ETFS ROBO Global Robotics and Atmtn ETF | 134.47 | 24.14 | 0.69% | 0.20% | 10.67% | 6.65% | 17.92% | 1.67% | Annual | ETF | Equity World Mid/Small | 3 | |
| Equities - Strategy | |||||||||||||
| [ETHI] BetaShares Global Sstnbty Leaders ETF | 247.58 | 22.89 | 0.59% | 0.20% | 5.74% | 8.27% | 27.59% | 1.67% | Semi-Annual | ETF | Equity World Large Blend | 3 | |
| [MOAT] Market Vectors Morningstar Wide Moat ETF | 72.82 | 8.16 | 0.49% | 0.25% | 8.80% | 9.58% | 27.00% | 0.76% | Annual | ETF | Equity North America | 3 | |
| [QMIX] SPDR MSCI World Quality Mix | 9.12 | 0.03 | 0.40% | 0.24% | 6.04% | 7.48% | 20.59% | 2.34% | Semi-Annual | ETF | Equity World Large Blend | 2 | |
| [TECH] ETFS Morningstar Global Technology ETF | 75.92 | 14.20 | 0.45% | 0.18% | 17.99% | 8.47% | 36.30% | 5.13% | Semi-Annual | ETF | Equity Global Technology | 3 | |
| [WDIV] SPDR S&P Global Dividend ETF | 190.52 | 12.97 | 0.50% | 0.17% | 4.88% | 3.53% | 12.46% | 7.69% | Semi-Annual | ETF | Equity World Large Value | 3 | |
| [WDMF] iShares Edge MSCI World Multifactor ETF | 155.51 | 80.81 | 0.35% | 0.24% | 23.04% | 5.55% | 19.26% | 3.13% | Semi-Annual | ETF | Equity World Large Blend | 3 | |
| [WRLD] BetaShares Managed Risk Global Share | 36.08 | 5.22 | 0.54% | 0.26% | 11.08% | 6.84% | 16.78% | 1.43% | Annual | MF | Multisector Aggressive | NR | |
| [WVOL] iShares Edge MSCI World Minimum Volume ETF | 17.98 | 7.07 | 0.30% | 0.56% | 17.34% | 6.01% | 17.20% | 4.39% | Semi-Annual | ETF | Equity World Large Blend | 2 | |
| [MOGL] Montgomery Global Equities (Managed Fd) | 94.50 | 10.61 | 1.32% | 0.45% | 7.19% | 1.74% | 0.00% | 2.37% | Semi-Annual | MF | Equity World Large Blend | NR | |
| [ESGI] VanEck Vectors MSCI International Sustainability Equities ETF | 11.29 | 6.55 | 0.55% | 0.34% | 28.19% | 7.01% | 0.00% | 0.44% | Annual | ETF | Equity World Large Blend | 2 | |
| [VMIN] Vanguard Global Minimum Volatil Act ETF | 5.85 | 3.72 | 0.28% | 0.38% | 38.95% | 2.68% | 0.00% | 0.00% | Quarterly | ETF | Equity World - Currency Hedged | 2 | |
| [VVLU] Vanguard Global Value Equity Active ETF | 11.33 | 4.94 | 0.28% | 0.46% | 28.39% | 3.93% | 0.00% | 5.09% | Quarterly | ETF | Equity World Large Value | 2 | |
| [ACDC] ETFS Battery Tech and Lithium | 1.03 | 1.03 | 0.82% | 0.34% | 406.03% | 0.00% | 0.00% | 0.00% | Annual | ETF | Equity Global Resources | 1 | |
| [VESG] Vanguard Ethically Conscious International Shares Index ETF | 1.01 | 1.01 | 0.18% | 0.26% | 32.62% | 0.00% | 0.00% | 0.00% | Quarterly | ETF | Equity World Large Blend | 2 | |
| [WCMQ] WCM Quality Global Growth Fund (managed fund) | 49.70 | 49.70 | 1.35% | 0.44% | 10.34% | 0.00% | 0.00% | 0.00% | Semi-Annual | MF | Equity World Large Blend | NR | |
| [RBTZ] BetaShares Global Rbtc & Artfcl Intlgc ETF | 2.04 | 2.04 | 0.57% | 0.28% | 526.65% | 0.00% | 0.00% | 0.00% | Annual | ETF | Equity World Large Blend | 1 | |
Source: ASX and Morningstar
Glossary
Bid-offer spread: is the bid offer spread is the difference between the highest price that a buyer is willing to pay and the lowest price a seller is willing to sell at.
Commodity: A raw material or primary agricultural product that can be bought and sold.
Currency Hedging: is a risk management technique companies can use to hedge their foreign exchange risk usually using forward contracts and options.
Derivative: A derivative is a contract that derives its value from an underlying asset.
Diversified: Diversification is a way of managing risk by investing in a variety of lowly correlated securities.
Domicile: The legal home country of a company.
Equal Weighted: means that each stock is given the same weight in a portfolio.
ETF: An ETF is an investment fund that is traded on a stock exchange, tracking an index.
Floating rate securities: an investment with variable interest payments based on a floating rate.
Flows: The amount of money coming into or out of a fund.
Fully replicating: An ETF that tracks the benchmark index by holding all the stocks in the index.
Funds under Management (FUM): The market value of the assets which a fund manages on behalf of investors.
Hidden liquidity: refers to the stock of units held by the Market Makers. Their job is to ensure sufficient liquidity is available during market hours around the ETFs NAV. It is referred to as ‘hidden’ as they will tend to only place volume on the screen as required.
Leverage: using debt to finance assets.
Liquidity: describes the degree to which an asset or security can be quickly bought or sold in the market without affecting the asset’s price.
Managed Funds (MF): if you invest in a managed fund your money, along with those of other investors will be collectively invested by an investment team in various assets.
Management Expense Ratio (MER): A fee charged to the assets of a fund used to pay for the costs of running the fund.
Market Capitalisation: The number of shares outstanding multiplied by the share price
Multisector aggressive: Funds that invest in a number of sectors and are heavily weighted towards growth assets
Multisector asset allocation: Funds that invest across a number of sectors.
On screen liquidity: simply refers to the publicly quoted bid and offers you see when you look at a trading screen.
Optimised/partially replicating: As opposed for fully replicating, partially replicating ETFs track the benchmark index without holding all the stocks in the index.
PDS: product disclosure statement is a document, or sometimes a group of documents, that contains information about a financial product including any significant benefits and risks, the cost of the financial product and the fees and charges that the financial product issuer may receive.
Prospectus: A Prospectus is a formal legal document that is issued upon on listing on an exchange. It outlines how the raised money will be used and should contain all the information required for investors to make an informed decision.
Security: a tradeable financial asset.
Separately Managed Account (PMA): Unlike a managed fund, a PMA is not a pooled investment. A Professionally Managed Account (PMA) is an investment portfolio managed by our investment team that is unique and tailored to your individual needs. Under a PMA, you hold legal ownership and the underlying securities are registered under your name.
Spread: The difference between the price at which someone is willing to buy a security and the price at which someone is willing to sell a security
Star Rating: InvestSMART’s star rating is a measure of key quantifiable metrics for ETFs: size, fees, liquidity, spread, tracking error
Structured Products (SP): This refers to a security or derivative which gives financial exposure to the performance of an underlying instrument. Types of structured products include Exchange Traded Commodities (ETCs) and Exchange Traded Notes (ETNs).
Tracking difference: The difference in returns of ETF to its Benchmark for a given period
Tracking error: refers to the volatility of the tracking difference
Underlying liquidity: refers to the liquidity in the underlying market that the ETF is designed to track. Underlying liquidity is the most important measure of liquidity when reviewing an ETF. You will find that the less liquid the underlying index, the wider the on-market bid-ask spread tends to be to account for the transactional costs involved in dealing.
Yield: The income return on an investment, such as interest or dividends received from holding it. Yield is usually expressed as an annual percentage rate.
Suitable for all investors as a total portfolio solution or the core of an investment plan.
IMPORTANT: This information is general advice only and has been prepared without considering your financial situation or objectives and you should consider if the information is appropriate for your circumstances before making an investment decision. Before acting on this information, please ensure that you read all relevant disclosure documents, including but not limited to, the Product Disclosure Statement (PDS) and Financial Services Guide (FSG). You may wish to speak to a financial advisor for further guidance. Numerical gures presented are accurate at the time of preparation and where required, further disclosure will be appropriately provided. Past performance cannot be relied upon for future performance. Information presented, gures quoted and diagrams are accurate as at 31 December 2017. Exchange listed managed funds are included in this report but not rated. Before making any investment decisions, please read the latest PDS provided by each ETF issuer and check all relevant ETF fees, as they are subject to change without notice.


Frequently Asked Questions about this Article…
Exchange Traded Products (ETPs) are investment funds traded on stock exchanges, similar to stocks. They are popular among investors because they offer a low-cost, hassle-free way to achieve investment objectives, such as portfolio diversification or exposure to specific investment themes. Their transparency and relatively low cost have contributed to their growing popularity.
ETFs track an index using two main replication methods: physical and synthetic. Physical replication involves holding the actual securities of the index, either fully or partially. Synthetic replication uses derivatives like swaps to mimic index returns. Each method carries different risks and costs, such as tracking error and counterparty risk.
The InvestSMART Star Rating is a quantitative measure designed to help investors compare ETFs with similar objectives. It evaluates key criteria such as size, fees, liquidity, spread, and tracking error. However, it does not account for individual investment objectives and is not a recommendation.
ETPs allow investors to diversify their portfolios by providing access to various asset classes, such as bonds, international equities, and infrastructure assets. This diversification helps manage risk and can improve long-term investment outcomes by spreading exposure across different sectors and geographies.
ETPs can act as a stop-gap investment strategy by keeping investors exposed to the market during times when they are unable to find suitable investment opportunities. They offer liquidity and can be easily bought or sold without additional paperwork or exit fees, making them a flexible option for maintaining market exposure.
Synthetic replication in ETFs involves using derivatives to replicate index returns, which introduces counterparty risk. This means that the ETF's performance depends on the financial health of the derivative issuer. Additionally, synthetic ETFs may not fully replicate the index, leading to tracking error.
InvestSMART categorizes ETPs by asset class to help investors quickly identify suitable securities for their portfolios. The asset classes include commodities, currency, diversified, equities, fixed income & cash, and property & infrastructure. This categorization aids in aligning investments with specific objectives.
The key thematics impacting markets include rising bond yields, tighter financial conditions, and equity risk premiums topping out. These factors are influenced by strong economic growth, inflation, and corporate earnings, leading to central banks tightening policies to prevent overheating. These thematics guide InvestSMART's strategy towards 'Value' and 'Defensive' indices and sectors.


