Four surprising maps about American renewables
When the US Energy Information Administration launched its new US Energy Mapping System last fall and upgraded it for use on mobile devices in early June, it powered a system allowing anyone to visualise some of the reams of data the EIA compiles on all things energy-related in the country.
That mapping system has a lot to show about renewables – critical to reducing climate change-driving greenhouse gas emissions – and the spread of renewables development across the continent. Here are four cool things the new Energy Mapping System can show you about where renewable energy is being produced and where it has the potential to be generated in the future:
1. Wind turbines are being built in places you may not expect
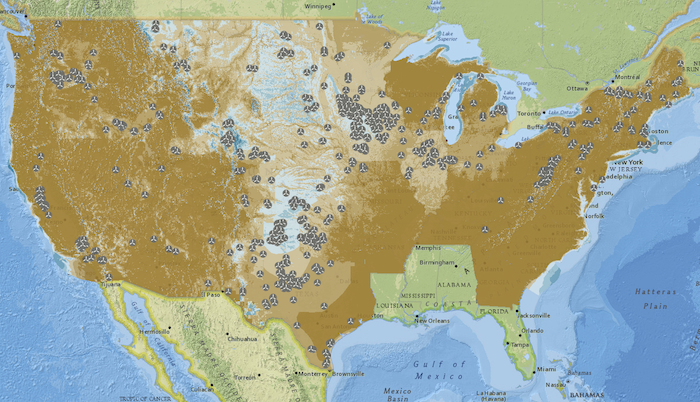
The solar power potential of the contiguous US and the sites of most of the nation's solar power generating facilities. The darker the shade of brown, the greater the solar power production potential of an area.
This is especially true in Pennsylvania, where wind farms sprawl along ridge tops in regions that, at first blush, look like there is little wind potential at all. But Pennsylvania generated 2.1 million megawatt hours of wind power in 2012, about as much as windy New Mexico, EIA data show.
New York, another Northeast state shown on the EIA map as having little wind potential, generated even more wind power than Pennsylvania in 2012. New York produced nearly 3 million megawatt hours of wind power in 2012, about half that of Colorado.
The maps also show large areas of the US with high wind power potential going untapped, especially in South Dakota and along the Colorado Front Range near Denver. These areas are highlighted in bright blue on the map.
2. The cloudier Northeast has its share of solar power
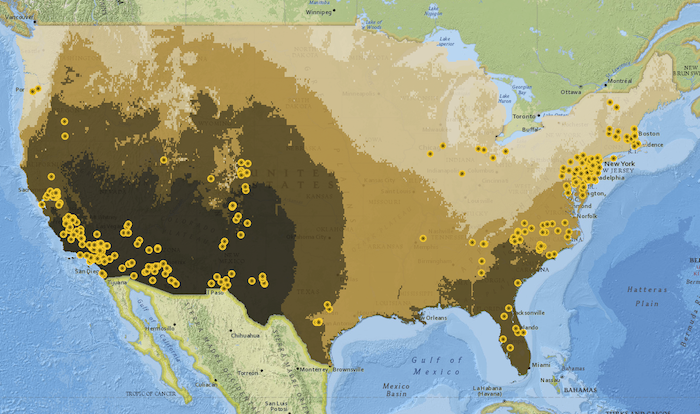
The solar power potential of the contiguous US and the sites of most of the nation's solar power generating facilities. The darker the shade of brown, the greater the solar power production potential of an area.

The EIA’s map shows that many solar power plants are where you’d expect them to be – in Arizona, Nevada and California where sunny skies are the defining feature of the climate there. But solar power plants are also spread throughout New Jersey, New York and New England, where the solar power potential is fairly low.
Sure, some of the nation’s largest solar power plants are in Arizona and California, but the map shows that, though the solar power plants in the Northeast are generally small, solar can be done there, too.
New Jersey, for example, produced about twice as much solar power in 2012 as sunny Colorado did and nearly a third more solar power in 2012 as Florida, where the solar power potential is significantly greater than anywhere in the Northeast.EIA data show that New Jersey produced 304,000 megawatt hours of solar power that year, while Florida produced 194,000 megawatt hours and Colorado produced 165,000.
3. Biomass power production is all over, but mainly in the east and Midwest
The biomass power production potential and biomass power plants scattered across the Lower 48 states. The darker the shade of green, the greater the biomass power production potential. Biomass power plants can be anything from solid waste incinerators to landfills generating power from burning methane emissions.
Source: EIA
Biomass energy comes from many different sources, primarily the burning of wood and wood products and capturing and burning landfill gas and other waste gases. Nationally, more than 57 million megawatt hours of electricity were produced from biomass sources in 2012, with Florida and California producing the most biomass energy.
But the EIA maps show that most facilities producing biomass electricity are concentrated in the Northeast, Upper Midwest and South, especially around Miami, Chicago, Detroit and New York City.
The power plants shown on the EIA map use a wide range of sources of fuel to produce electricity. For example, The Covanta Essex Company’s 60 megawatt Covanta Essex resource recovery plant in Essex County, N.J., produces electricity by burning more than 2,800 tons of municipal solid waste each day. An irrigation district in Turlock, Calif., burns methane produced from the treatment of wastewater to generate 1.2 megawatts of electricity.
4. The US has great geothermal potential; most of it is untapped
The geothermal power production potential across the country and the sites of current geothermal power plants in the US The darker the shade of brown, the higher the geothermal power production potential of the area.
Source: EIA
Nevada, California, Utah, New Mexico, western Colorado are all places with large geothermal resources (heat from places where molten rock comes relatively close to the earth’s surface). But nationwide, there are only a handful of geothermal power plants, which in 2012 produced about 15.5 million megawatt hours of electricity, mostly in California, where geothermal accounts for roughly 5 percent of the state’s power generation, according to EIA data.
Geothermal power generation has been slow, according to EIA data, mainly because of the cost and risk involved in building new geothermal power plants, which can take up to eight years longer to complete than wind and solar power generating facilities.
Originally published by Climate Central. Reproduced with permission.


