Five graphs that will change your mind on power prices
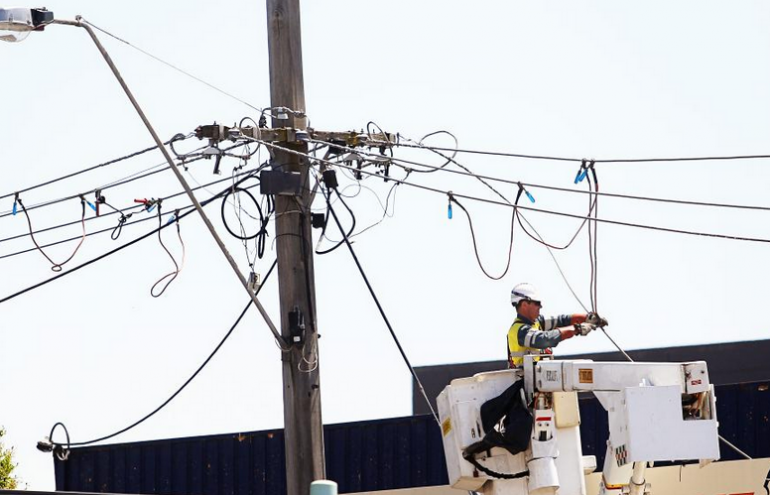
Meet the true culprit behind high power prices. Image: AP
There are plenty of issues that get Australians going: mishandling of the NBN, middle-class welfare, and high housing prices, to name a few.
But there's one issue that sparks outcry like no other. And to make matters worse, it's is riddled with misinformation. In case you missed the headline; we’re talking about power prices.
It’s well documented that power prices in Australia have taken a steep climb in the past couple of years. But, does the every day Australian truly understand why this is the case? We’ll give you a hint: it’s not as simple as just blaming the carbon tax.
An excellent article in The Monthly clearly outlined the problem with this much-talked about topic: distribution costs. It resonated with our own publication, Climate Spectator, which has long campaigned on this issue, including in an article published last year. (A power price reality check, March 25 2013.)
Sign up to Climate Spectator’s newsletter here
Both of the above are great resources if you are after more detail on the matter. But if you’re looking for a basic version of the narrative -- something with pictures that will take a couple of minutes to absorb -- we’ve collated some graphs and diagrams to explain (and hopefully inform opinions) on power prices in Australia.
First off: get angry. According to the latest study on the matter, Australia now has some of the highest power prices in the developed world.
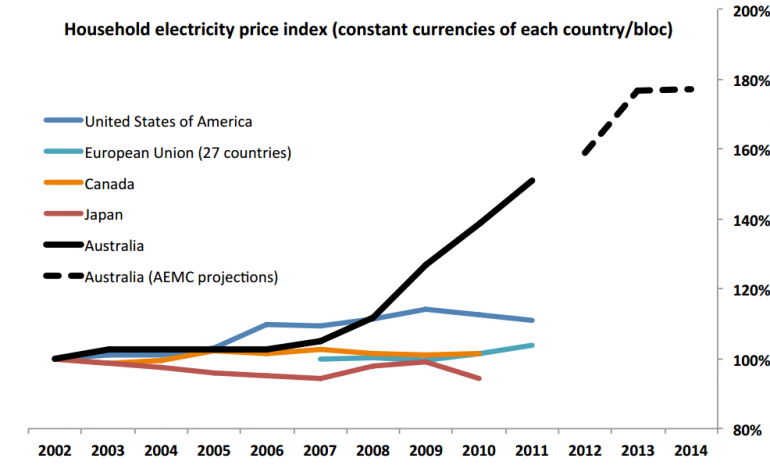
Source: EUAA
So why is this the case? Well, to understand this you need to know how power is generated and distributed to consumers and businesses. Here’s a quick diagram showing all the parties involved. Consumers only deal with the retailer, but they are only the shopfront for the other companies operating the other facets of the network.
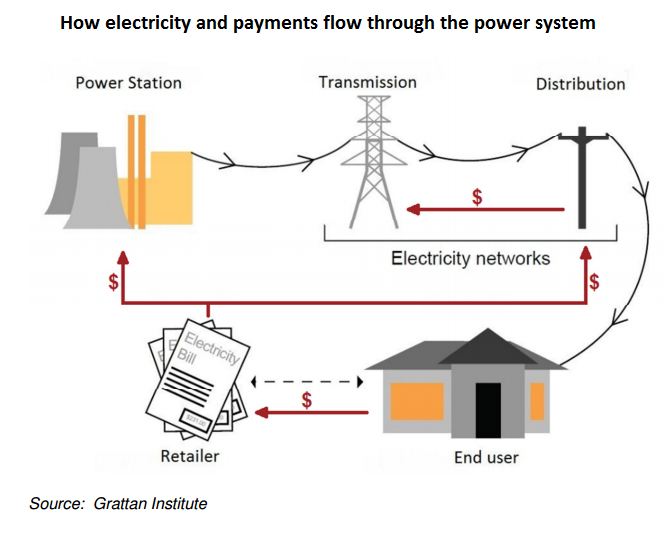
Source: Grattan Institute
Back to pricing, and while the carbon price plays a part, it’s not as influential as you may think. Indeed, the majority is going towards the distributors.
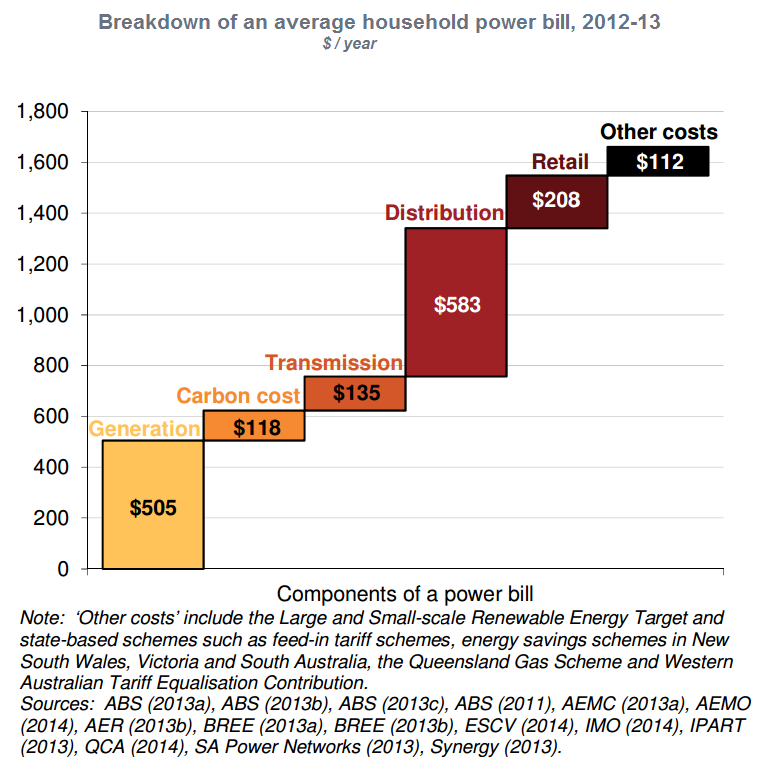
Source: Grattan Institute
Why? Well, the price hike is to compensate them for ongoing federal government-approved investment in Australia’s power grid. Back in 2009 it was argued that this investment would be required to cater to our increasing power demands. The regulatory framework allows distributors to build infrastructure where needed and pass on these costs to consumers. Hence, in the past five years their revenues have skyrocketed.
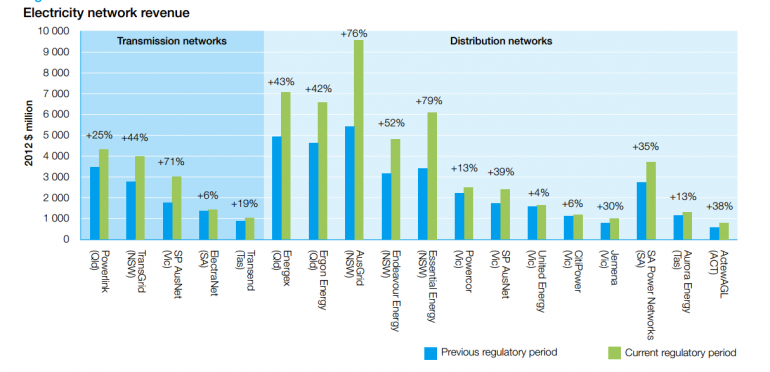
But demand didn’t increase. It fell, rapidly. (By the way, NEM means national electricity market)
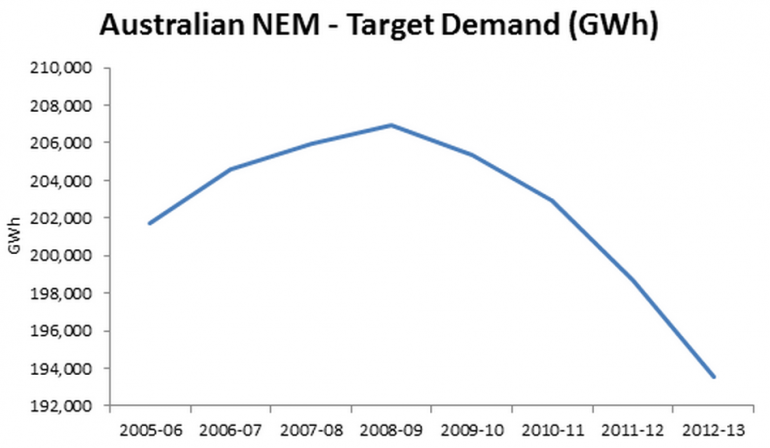
Source: ESAA
Energy efficient appliances, increased uptake of personal solar power and possibly the fear of the impact of the carbon tax -- ironically spurred on the Abbott government, which is railing against high power prices -- caused a drop in energy consumption, and hence a need to hike distribution prices to pay off network investment. A lack of regulatory oversight ultimately allowed this situation to occur.
The worst part is that despite a downward trend in electricity consumers, the grid is still being improved at the consumers expense. And electricity distributors are making a hefty margin off this situation.
That’s the short of it. To read the long version, check out The Monthly article or Climate Spectator.
Addition: After the publication of this article, a reader forwarded some data on 2013 power prices that shows how Australia compares to the rest of the world. According to that data, we rank fifth, with Italy coming in first place for the world’s highest prices. See the full graph here.
Got a question? Let us know in the comments below or contact the reporter @HarrisonPolites on Twitter.


