Clive Palmer's emissions trading world
Two days ago Clive Palmer stated his proposed emissions trading scheme should be calibrated to the actions by five other jurisdictions: the European Union, the United States, China, Japan and South Korea. He also suggested our carbon price (soon to be around $25) was far higher than what else was in place around the world.
Now we all know that Europe has an emissions trading scheme in place. But it might be worthwhile looking at what else is happening overseas in Clive’s emissions trading and carbon tax world?
United States
A lot of people don’t seem to have caught up with the implications of the recently unveiled US EPA Clean Power Plan requirements that will apply to existing US power stations. The Clean Power Plan, for all intents and purposes, means the US will be implementing an emissions trading scheme.
The way it works is that the EPA has set electricity CO2 emissions intensity targets for each state in the US similar to what they do with another pollutant – SO2. States are obligated to achieve these targets but are free to choose the regulatory means to achieve such targets.
What most will end up doing, just as occurred with SO2, is to comply with these targets via establishing regional emissions trading schemes across states. That’s because allowing market trade provides greater flexibility where the power plants, firms and even states best equipped to reduce emissions at lowest cost do so, and those who face high opportunity costs to reduce emissions don’t bother.
As explained in the article, Abbott stop telling fibs about Obama’s climate change plan, the end result is that in 2030 Australia’s electricity supply will be 60 per cent more polluting than the US in terms of greenhouse gases.
It’s also worth noting that the US has mandatory motor vehicle CO2 emissions standards which mean that in 2025 our cars will emit 50 per cent more CO2 per kilometre driven than those sold in the US, as explained in the article, Car fuel economy standards deliver 2-year payback.
South Korea
South Korea’s emissions trading scheme will commence on January 1 next year. Approximately 490 of the country’s largest emitters, which account for roughly 60 per cent of the country’s annual GHG emissions, will receive emission caps. The scheme is targeted to reduce emissions by 236 MtCO2e (Australia’s annual emissions are close to 550MtCO2-e), or 29 per cent, from business as usual levels by 2020 as part of an overall target to reduce Korea’s emissions 4 per cent below 2005 levels.
According to the International Carbon Action Partnership (December 2012), the Korean ETS non-compliance penalty will be set at three times the prevailing market price, and the maximum penalty will be KRW 100,000 per tonne, or about $US94/tCO2e.
China
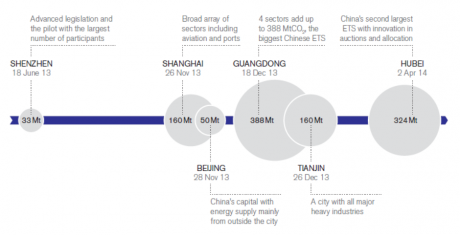
According to the World Bank, China is expected to establish a national emissions trading scheme in the next five-year plan (2016-2020). As part of its preparations for a national rollout it established several pilot schemes over the last 12 months, as detailed in the diagram below.
Source: World Bank (2014) State and trends of carbon pricing – 2014
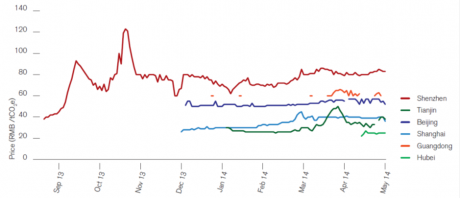
It’s worth noting that these pilot schemes (as you’d expect for pilots) are far from perfect and some encounter a range of issues that affect their environmental effectiveness. Still, the scope of these schemes is significant in global terms. Traded prices so far range from $US4 in Hubei to $US12.40 in Shenzhen. The traded history of permit prices is detailed below.
Source: World Bank (2014) State and trends of carbon pricing – 2014, citing combined information Crystal carbon website of Chinese emission exchanges as of April 18, 2014.
Japan
Japan has an inconsequential $US2 carbon tax applying to 70 per cent of its emissions, as well as several regional schemes – including in the city of Tokyo – covering about 8 per cent of the country’s emissions.
Still, given Japan’s emissions per capita are 9.5 tonnes of CO2, while ours are 25 tonnes, and by any metric their economy is vastly less emissions-intensive than our own, it might not really be such a great idea to use them as an excuse for our inaction.
Australia – the highest carbon tax in the world?
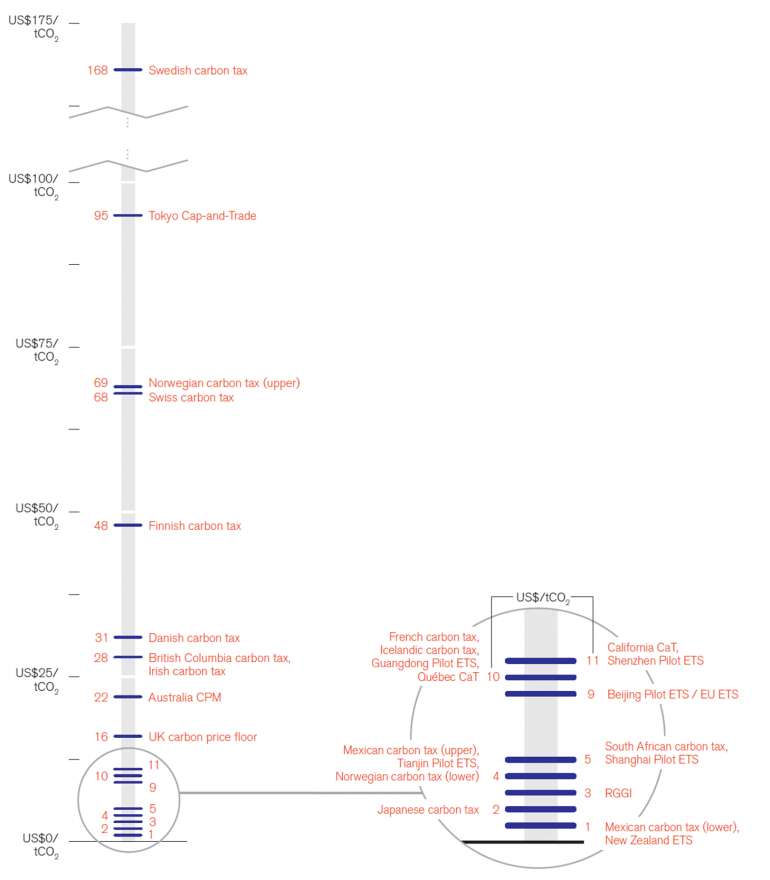
Finally it might be worthwhile taking stock on just how horribly high Australia’s carbon tax really is. The temperature gauge chart developed by the World Bank below pretty much tells the story. By the way, in some cases the carbon tax listed is in addition to the cost of buying a carbon permit under emission trading schemes also in place in some jurisdictions.

Source: World Bank (2014) State and trends of carbon pricing – 2014


