After-tax share returns can't be beaten


Summary: Over the past 20 years, Australian shares and residential property have been the standout asset classes, with returns well ahead of inflation. In terms of tax leakage, returns from Australian shares actually increase after tax due to franking credits, while a number of other asset classes have some tax efficiency, such as Australian residential property, international shares and Australian listed property. Over long time frames, returns from international shares are looking reasonable. |
Key take-out: Over the last two decades patient investors have received reasonable returns, despite the Global Financial Crisis and dot com crash. |
Key beneficiaries: General investors. Category: Investment portfolio construction. |
The ASX-Russell Long-term Investing Report has been released, looking at the 10 and 20 years to the end of December 2014, and contains a number of interesting elements for investors. As well as the returns of different asset classes, it provides an insight into the relative tax efficiency of different investments. As a starting point, the data lets us do some benchmarking of the investment returns from the past 10 and 20 years.
Benchmarking the returns: What has the market given over the past 10 and 20 years?
All major asset classes have provided positive returns over the past 10 and 20 years, although over the past 10 years Australian Listed Property Trusts (1.6 per cent pa) have failed to keep pace with inflation (2.7 per cent). This is important from a ‘real world' perspective, as it means that money invested into an average performing portfolio of listed property trusts 10 years ago, with dividends reinvested, would have actually decreased in purchasing power.
The standout performers have been Australian shares and residential property, with an average annual return of 9.5 per cent and 9.8 per cent per annum over the past 20 years. Looking beyond percentages, that return would have turned $100,000 into $614,161 if invested in Australian shares and $100,000 into $648,704 if invested in Australian residential property.
Over periods of time, it is important to consider returns from the perspective of how they relate to inflation, as that gives us an indication of the ‘purchasing power' of investments. It takes $170,376 today to buy the equivalent of $100,000 of goods from 20 years ago – showing that both Australian shares and Australian residential property have comfortably increased the purchasing power of investors.
A 20-year investment in cash, by contrast, would have seen $100,000 of cash increase in value to $206,812 – keeping ahead of inflation by only about $36,500.
The returns are ‘total returns' – a combination of any income and capital growth from an investment. They are generally based on a measure of the average market return – meaning that if, for example, your Australian share investments provided a higher rate of return your $100,000 some 20 years ago will be worth more than $614,161.
The following table sets out both the 10- and 20-year average annual return, and the calculations if $100,000 was invested in various asset classes over the past 10 and 20 years.
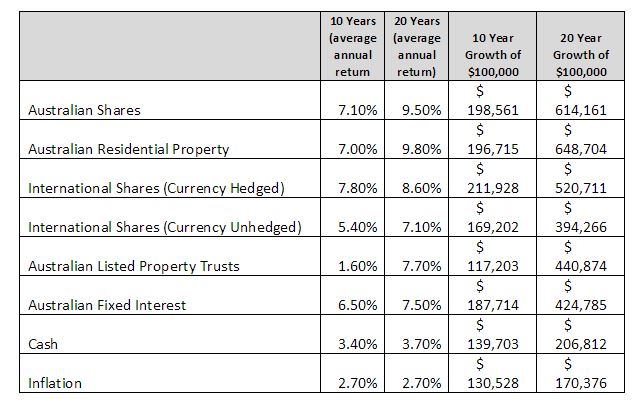
Source: ASX/Russell
‘Tax leakage' by asset class
A particularly interesting element of the ASX/Russell report is the calculation of after-tax returns. It is a great shame that the majority of the investment institutions do not calculate and emphasise after-tax returns. The reality of having to pay tax means that all of us receive ‘after-tax returns' – even a superannuation fund in pension mode with a 0 per cent tax rate is influenced by tax through the refund of franking credits.
The following graph compares the pre-tax return from various asset classes with the after tax return at the superannuation tax rate (15 per cent for income, 10 per cent for discount capital gains and no tax on capital gains if they are not sold). For investors looking for tax efficiency, the lower score your investment class gets on this graph the better – ideally they are negative.
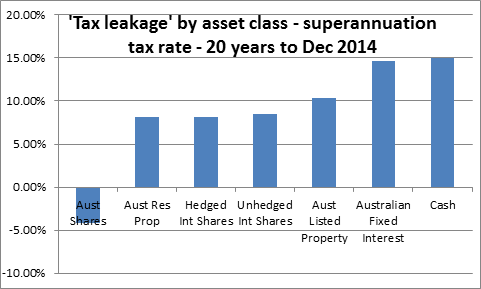
The results are close to what we would expect. The franking credits from Australian shares mean that asset class has a negative tax leakage – that is, returns actually increase after tax.
There are a number of asset classes with some tax efficiency, with between 8.2 per cent and 10.4 per cent of returns lost in tax – Australian residential property, international shares and Australian listed property. All these asset classes have an element of capital growth, which is concessionally taxed (10 per cent rate after 12 months – and only taxed when the assets are sold).
Moving to the fixed interest and cash investments, the tax situation is what we would expect. The vast majority of returns will be from taxable interest repayments, and so the ‘tax leakage' should be, and is, very close to the income tax rate in a superannuation fund of 15 per cent.
International share returns
After a period of poor returns from international shares, their returns are looking reasonable over long time frames – a good reminder of potential diversification away from Australia. Returns are calculated for both a currency hedged and currency unhedged strategy.
The decision about whether to use currency hedging or not is an important one for overseas investors. Over the past 10 and 20 years, hedging currency has been the winning strategy, with an extra 1.5 per cent per year of returns – a significant additional return. This extra return has been on the back of a rising Australian dollar. Over the past three years the fall in the Australian dollar has seen returns favour an unhedged strategy. In the three years to the end of June 2015, the Vanguard Hedged International share fund (an index fund) has produced a very acceptable return of 19.14 per cent pa. However the unhedged version of the same fund (Vanguard International shares) has outperformed this by some margin, with a 25.38 per cent pa return.
Conclusion
Any analysis of historical data has to be taken with a grain of salt – we have no idea of what the next 20 years of returns from investment markets will be. The latest ASX/Russell study of long-term returns does show us that over the last 20 years patient investors have received reasonable returns, and that after tax Australian shares have an advantage over other asset classes. The 20 year returns do provide interesting data, given that they include the returns from the Global Financial Crisis and ‘dot com' bubble crash – even over this time a patient investor who captured the average market return has been well rewarded.
Scott Francis is a personal finance commentator, and previously worked as an independent financial adviser. The comments published are not financial product recommendations and may not represent the views of Eureka Report. To the extent that it contains general advice it has been prepared without taking into account your objectives, financial situation or needs. Before acting on it you should consider its appropriateness, having regard to your objectives, financial situation and needs.


Frequently Asked Questions about this Article…
Over the past 20 years, Australian shares and residential property have been the standout asset classes, offering returns well ahead of inflation. Australian shares provided an average annual return of 9.5%, while residential property offered 9.8% per annum.
Franking credits on Australian shares can actually increase after-tax returns. This is because the credits offset the tax paid on dividends, making Australian shares a tax-efficient investment option.
Considering inflation is crucial because it affects the purchasing power of your investments. For instance, $100,000 invested in Australian shares 20 years ago would have grown significantly, comfortably increasing purchasing power despite inflation.
International shares have shown reasonable returns over long time frames. The decision to hedge currency can impact returns, with hedging generally providing an extra 1.5% per year over the past 10 and 20 years.
Tax leakage refers to the portion of investment returns lost to taxes. Australian shares have negative tax leakage due to franking credits, while other asset classes like residential property and international shares have some tax efficiency, losing between 8.2% and 10.4% of returns to tax.
Over the past 10 years, Australian Listed Property Trusts have underperformed, with an average annual return of 1.6%, failing to keep pace with inflation, which was 2.7%.
Currency hedging can significantly impact returns on international investments. Over the past 10 and 20 years, hedging has been beneficial, providing an additional 1.5% return per year. However, recent trends have favored unhedged strategies due to fluctuations in the Australian dollar.
Investors should take historical data with a grain of salt, as past performance does not guarantee future results. However, the data shows that patient investors have been well rewarded over the past 20 years, even through financial crises.


