A big data fix for leaky pipes
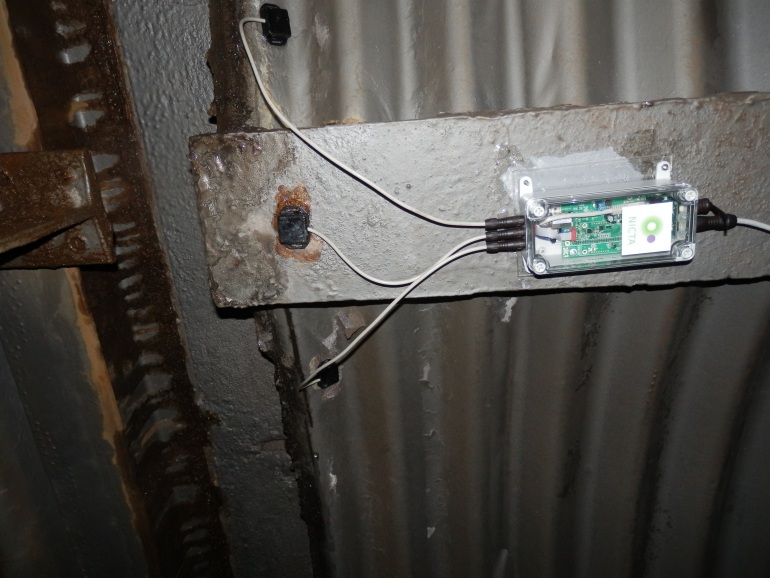
Scattered across the decking of the Sydney Harbour Bridge are thousands of tiny electronic ‘eyes’.
Their job is to constantly monitor the vibrations caused by the 58 million vehicles and 15,000 trains that cross the bridge every year.
If the vibrations they detect are deemed normal, all is good. If they report an abnormal finding, it could be the first sign that part of the bridge is not performing as it should, and an inspection crew is dispatched.
The system was developed by IT research organisation NICTA, and is just one example of how technologies from the Internet of Things and Big Data are saving millions of dollars in infrastructure maintenance costs by increasing relevant data, and providing the analytical grunt to make decisions in real time.
NSW Road and Management Services’ (RMS) strategic infrastructure manager Peter Mann says maintenance previously relied on visual inspections alone.
“To better manage the risk of user safety and journey disruption, more frequent inspections are a necessity, but are invariably limited by the availability of bridge inspectors,” he says. “With an automated structural health monitoring system thousands of ‘eyes’ can watch the bridge deck continuously at a tiny fraction of the cost of visual monitoring.”
These tiny eyes can detect faults sooner than thorough periodic visual inspection alone, leading to earlier and less disruptive repairs which may ultimately extend the life of the bridge. The technology is also applicable to many of the other 5071 bridges that RMS maintains.

Thousand of tiny sensors on the Sydney Harbour Bridge constantly monitor the bridge and send data back NSW Road and Management Services.
But while the benefits of the Internet of Things and Big Data analytics are becoming understood by infrastructure owners, their uptake amongst the groups responsible for planning and funding new infrastructure has been more subdued.
The managing director of Melbourne-based analytics specialist Predictive Analytics Group, Theo Gazos, says the methods used by planning departments in Australia mean they are not always working from the best data.
“What they tend to do is use cost benefit analysis, which can be assumption laden, and heuristic analysis, which is driven by political expediency,” Gazos says.
“The key issue is how do you use data to prioritise infrastructure, and what are the most appropriate tools to create an evidence base so you can prioritise infrastructure investment.”
Gazos is also critical of commonly-used computable general equilibrium (CGE) models that seek to quantify employment and economic impact, as they lack transparency in their formulation.
“This is why modern, more sophisticated analytical tools and simulation models that can account for a range of variables simultaneously need to be considered by the departments,” Gazos says. “Using outdated CGE models and outdated high-level cost benefit analysis and techniques like that are not going to help you really identify what is efficient and what is inefficient.”
Predictive Analytics Group has been involved in the development of a new city in Qatar which is being designed from scratch to collect data regarding its performance and feed this back to a central planning group. Gazos says some existing cities are also deploying sensors on public infrastructure, such as garbage trucks and emergency vehicles, to gather data.
“Because they are going to have all of this data they can better forecast and track costs going forward, not rely on CGE models,” Gazos says.
IBM Australia’s strategy and analytics leader Brock Douglas is also critical of the data sets used by planning departments.
“If you look at the way governments have done their planning, it has all been done on a forecasting basis,” Douglas says. “And the challenge with forecasting is it is based on very unreliable data. It tends to take in data that is five to ten years out of date.”
Douglas says the massive growth in the data available through channels such as mobile devices and social media should be taken into consideration.
“So if you take all that new data that’s available, and you bring in the cloud that allows people to quickly analyse it, you can get to a position where you can improve your forecasting situation,” Douglas says.
IBM is currently working on a project in Victoria that is analysing social data to predict bushfire hotspots.
Douglas says the ultimate goal is to move from using systems of record to systems of insight, where data is constantly collected and analysed for planning purposes. IBM is currently engaged in a project of this kind with Yarra Trams, having deployed 91,000 sensors across its network to assist in predicting maintenance requirements.
Just as the sources of data available are changing, so too are the tools available for analysing it.
Another NICTA project for Sydney Water is helping that organisation make better decisions about how it maintains and upgrades more than 80,000 kilometres of drinking and waste water pipes.
Sydney Water’s manager for research direction and value Michael Storey describes the project as transformational.
“With better use of our data and better use of our models we can better target our investment, to the order of many millions of dollars a year, in targeting renewals or deferring expenditure,” Storey says.
With the network’s age stretching back more than 100 years in parts, large chunks of data are incomplete. The NICTA technology algorithms are smart enough to make inferences about the missing data which have proven highly reliable.

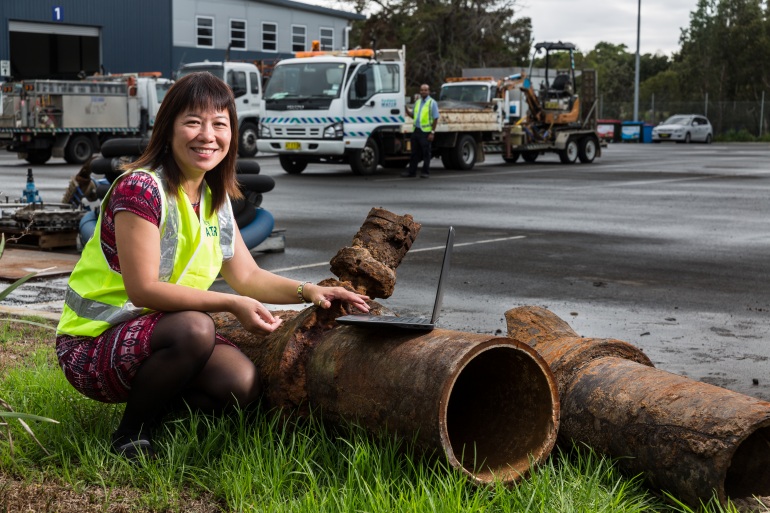
NICTA's Fang Chen is working with Sydney Water to help determine where infrastructure spend is most effective.
NICTA is combining Sydney Water’s existing data sets with external data regarding weather conditions and vehicular traffic. Weather reports can indicate soil shrinkage or expansion, which can accelerate failure rates for some materials. Other parts of the network were laid beneath roads with much heavier traffic volumes today than were ever planned for.
“We’ve collected a lot of data, but what we’ve seen in recent years is (growth in) the capacity of the IT systems to interrogate that data,” Storey says. “And that’s where we have really seen the benefits of working with people such as NICTA. With advanced analytics we have much more power to understand and interpret our data, and that’s the real game changer.”
Storey says that a more targeted maintenance program for its sewer infrastructure alone is likely to yield savings of between $4 million and $5 million.


