Why Apple is cheap
Imagine it's late 2005. Apple's fiscal year just ended and they reported their performance. You're an analyst whose job includes forecasting the company's performance for next year. This is a weighty responsibility. Your forecast will be blended with those of your peers and used as a “consensus” average. That consensus for the next year will be used to measure the current value of the shares in a ratio called the forward PEG or Price/Earnings/annual earnings Growth. You are supplying the earnings and hence growth forecast while the market offers a price. As a stock is meant to measure future earnings, your forecast is a crucial and frequently cited figure about whether a stock is priced fairly.
There is some comfort in knowing that there will be many others who will offer such a forecast and your contribution is thus not the only way investors can calibrate the price. However, you should think hard about what you are predicting as it also will reflect your skill in predicting such a visible company.
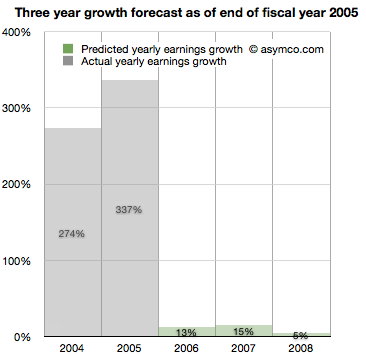
Apple just had a tremendous two years. 2004 and 2005 saw EPS grow at 274 per cent and 337per cent. This is largely due to the runaway hit iPod. Given all that is known about the company, what will you put forward? While you're at it can you also forecast two years forward, namely provide a growth forecast for 2006, 2007 and 2008?
Here is what you and your cohorts publish as a consensus:
You go with a 13 per cent growth for 2006, 15 per cent for 2007 and five per cent for 2008. The chances are, you reason, that the iPod will not carry the company's growth much longer. The competition is sprouting all over and Microsoft is rumored to be launching its own music player.
It makes sense to be conservative and offer a modest growth of 13 pe rcent . At the same time you can rate the stock a buy as it is still growing. The stock just doubled in the last 12 months and the law of large numbers says that growth cannot last at the same rate as we've just seen.
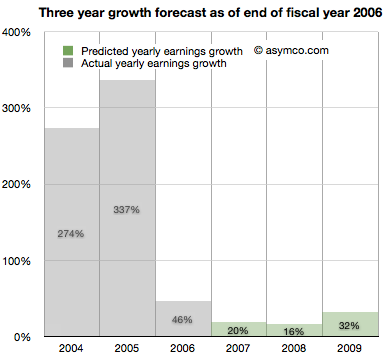
It's now late 2006. Apple just closed out another big year. Contrary to your forecast last year, the company grew at a rate of 46 per cent, more than three times faster than you expected.
It turns out the iPod still has some legs and the company's Mac business seems to be growing. Looking forward you take your 15 per cent growth for 2007 and increase it to 20per cent and suggest 16 per cent for 2008 and 32 per cent for 2009.
There are rumours of Apple getting into the phone business.
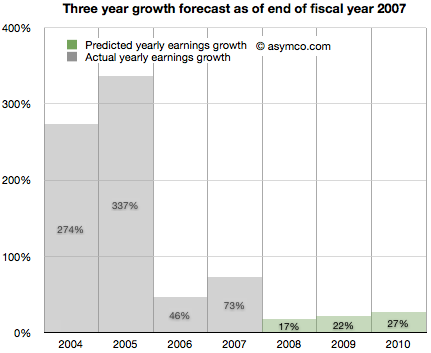
It's now late 2007. Apple just launched the iPhone and even though it was available in limited numbers on one carrier for one full quarter, the company still turned in an amazing 73 per cent. Again more than three times faster growth than you forecast. What do you do about 2008?
It might make sense to increase the previous 16 per cent estimate to 17 per cent but since there is a real estate bubble brewing, the 32 per cent growth for 2009 should come down to 22 per cent and defer that grow th out to 2010, dia ling in 27 per cent.
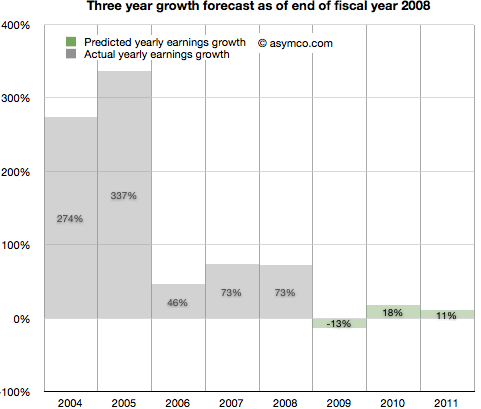
It's now late 2008. Apple closed out another huge year. 73 per cent growth was once again more than triple your forecast of 17 per cent growth. It's clear that the iPhone is a huge hit.
However, there is a credit crunch and talk of a huge recession, even depression looming. Apple is a luxury/premium brand and it is unlikely that those expensive products will sell well into these “macro headwinds”. You predict a decline in the earnings of 13 per cent in 2009, inline with many other tech stocks. You are optimistic however that 2010 will be a year of recovery and predict 18per cent increase from recession lows followed by a more reasonable 11 per cent growth in 2011.
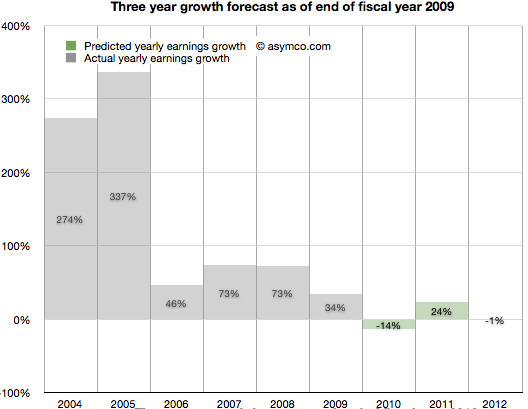
It's now late 2009. To everyone's surprise, Apple grew through the credit crisis. It turned in 34 per cent growth (vs. your predicted 13 per cent decline). The success is hard to believe but the iPhone had a lot to do with that. There are new competitors coming and the recession has proven resilient. With unemployment still high you predict 2010 will still be a tough year. You go with -14 per cent growth for 2010 and postpone recovery out to 2011 with 24 per cent “bounce”. Longer term you see 2012 as a flat year, with Apple earnings shrinking slightly by one per cent.
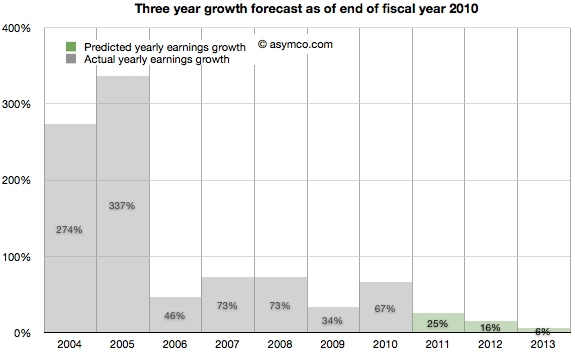
2010 ends with Apple achieving 67 per cent growth. Shocking relative to a -14 per cent growth forecast. But then again, Apple launched the iPad and who could have thought that was a hit? Apple achieved growth throughout the recession and it looks like it might keep going. Your 2011 forecast of 24 per cent looks weak so you increase it to 25 per cent. The 2012 decline thesis is abandoned in favor of 16 per cent growth and, given the likely competition in smartphones, you tone down growth in 2013 to six per cent.
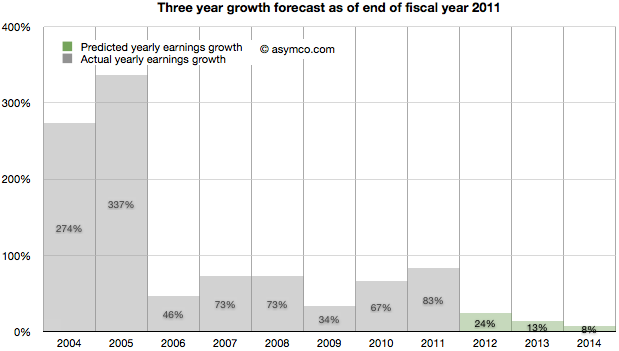
It's November 2011. The company turned in 83 per cent growth. It's more than three times faster than your forecast. Some people are suggesting that Apple may have a lot of headroom with the iPhone and iPad but the law of large numbers is what it is. The company became the largest by market cap in the world and Android is gaining huge market share. However, in deference to their strong recent performance you increase the 2012 forecast from 16 per cent growth to 24 per cent growth. 2013 goes from six per cent to more than double: 13 pe rcent and 2014 is when growth begins to slacken, though still a healthy eight per cent.
As the following chart shows, look ahead one year accuracy has not been all that great, but you are at least consistent. In any case, everything you based your decisions on showed remarkable consistency with consensus. You're just reflecting common sense.
Now, I woukl like to point out that alhough the numbers are all real, the narrative is fictitious. However, I suspect that the truth is actually stranger than this fiction.
The debate brings into light the possible causes for pessimism in the face of overwhelming evidence to the contrary. But maybe there is yet another explanation. The way the data was presented was as a difference between historic and projected growth rates. Is this the way analysts actually think?
The following chart shows that data, i.e. forecasts as an extension of a sales trajectory. The blue area are actuals and the grey branches show projections at a given end of fiscal year.

Seen this way, we can imagine how the projections can be considered “reasonable”. Some appear to be linear extrapolations while others show up as the end of “S-curves”.
What none of them imply is exponential growth. But would forecasting exponential growth be considered reasonable? Clearly not, since it's never been consensus but disruptive companies do follow non-linear growth.
In fact, every company that has gone from being small to being big (which is to say all large companies) went through non-linear growth phases. The “natural” shape of growth is exponential.
The failure is therefore not of reason but of failing to use a model that assumes acceleration of sales. I believe that institutional financial advisors are conditioned (or coerced) into assuming that nothing unreasonable ever happens. That seems like a completely flawed foundation to stand on.
Horace Dediu is founder and managing director of Asymco, a Helsinki-based app developer/industry analysis advisory firm. You can find his blog here.


