The housing bubble Whodunnit
This article is the third in a series on Australia’s housing market. Read the first article here and second article here.
In the last two articles in this series, I argued that Australia’s house prices “walk like a duck” – using BIS data, Australia is one of only four countries where prices are twice as high in real terms as they were in 1985. And they “quack like a duck” – accelerating household debt is a major driver of rising house prices, as in the other present and past house price bubble economies (the US, Spain, Japan, Norway, the UK and Denmark). So having concluded they’re a duck, what species of duck are they?
At first glance, the Australian house price bubble does appear to be a different species to its European and American brethren. Tacking Nigel Stapleton’s data onto the ABS series, we can develop an index for Australia going back to 1880 – compared to 1890 for America’s Shiller Index and (wait for it) 1628 for the Herengracht Canal Index. With 350 years of data, there is clearly no trend to the European series; and after the subprime crash, any argument that there is a trend to US prices now looks pretty shabby – even though prices are clearly rising once more in the Land of the Surveilled (see Figure 1).
Figure 1: Long term real house price indices
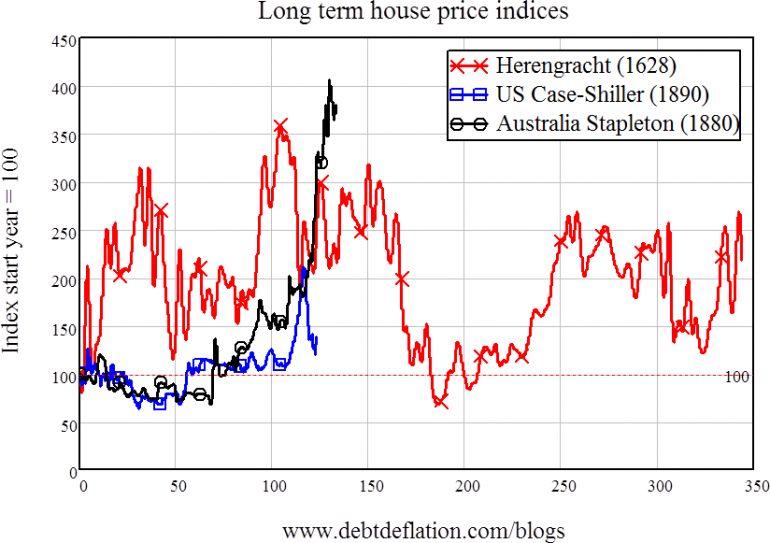
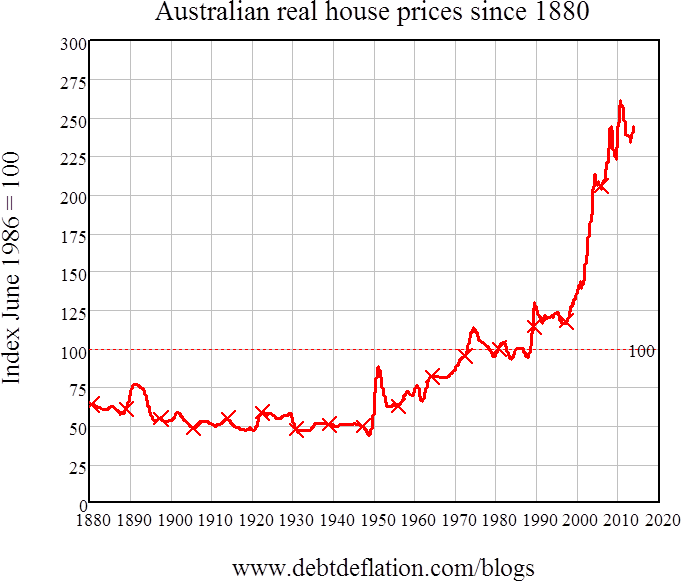
Australian prices had no trend before 1955 (75 years after Stapledon’s data begins) either. However, and though this may sound positively un-Australian today, this could be because until then government policy actually favoured tenants over landlords! Since those unpatriotic rent controls were removed, Australian house prices have boomed. So the first obvious characteristic of the Australian market is that there has been an upward trend to Australian house prices since 1955.
Is this upward trend the free market at work? Not on your Nellie. For the years from 1955 till 1983, the government’s chief intervention was negative gearing – allegedly for the benefit of landlord and tenant alike, but clearly financially directly favouring landlords – and the market was also slowly adjusting to the opposing force of the gradual removal of rent controls. The period from 1970 till 1983 can therefore be regarded as an interregnum between the reign of tenants as the protected species in Australian housing, and the reign of landlords.
Coincidentally, the average value of the long-term index then was precisely the same as in June 1986, when the ABS began its own house price data series. So I regard Figure 2 as an accurate picture of the level of real house prices in Australia.
Figure 2: Australian real house prices since 1880
This makes 1985 a good date to select to compare Australia’s still-officially-denied bubble to undeniable bubbles overseas. While we didn’t blow up as fast, our bubble is now bigger in real terms than Japan’s, dwarfs America’s – though we were on a par until 2006 – and is put in the shade only by the UK and The Netherlands.
Figure 3: Real house prices since 1985
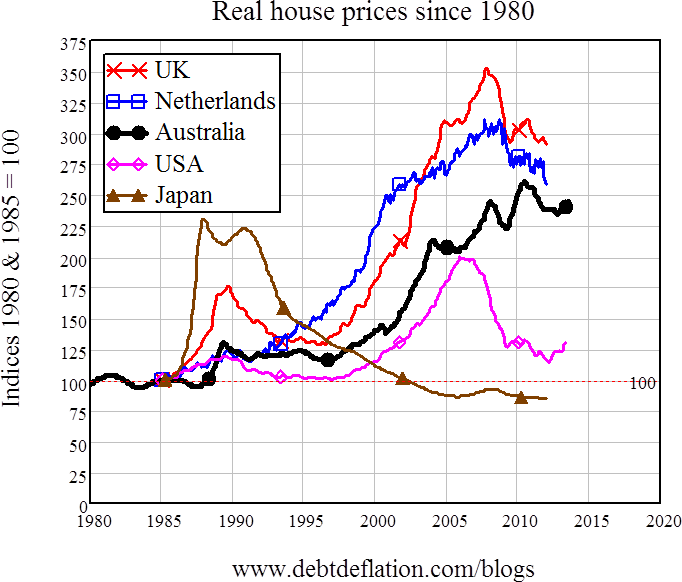
I’ve omitted high-priced Belgium because that is the one country where debt doesn’t appear to have played a major role in driving house prices higher – maybe instead Brussels is bubbling because of the lowly-taxed high incomes of all those EU bureaucrats. The other bubbles however are largely the creation of what I dub the ‘Politico-Financial Complex’ – the mixture of electorally-driven politicians and profit-driven banks that has turned out to be a far greater danger to capitalism than the military-industrial complex which exercised Eisenhower’s mind back in the early 1960s. The pen has indeed turned out to be mightier than the sword, but it is the banker’s pen, not the poet’s, that has ruled.
That has been the case in every bubble economy, as noted in last week’s post, with the PFC’s signature being the correlation of accelerating mortgage debt with rising house prices.
In contrast to Republican spin, which blames the subprime bubble on government policy to encourage home ownership, the US saw the purest ‘bank-driven’ bubble, with the correlation between mortgage debt acceleration and house price change a staggering 0.82 from mid-1992 till now (and 0.7 using the BIS household debt data I used in the last post) – see Figure 4.
Figure 4: The US correlation of mortgage acceleration and rising house prices (Correlation 0.82)
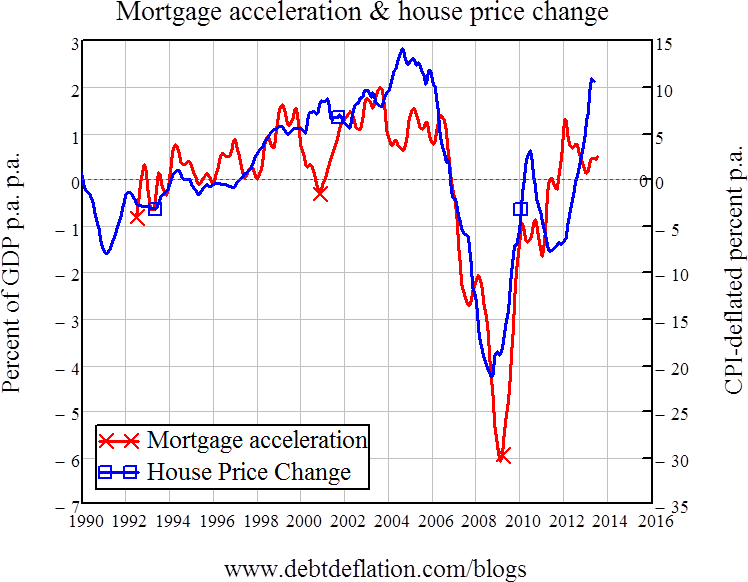
The Australian correlation was still high at 0.62 over the period covered in Figure 5 (I had to use mid-1992 as a starting point because of a break in the Reserve Bank data series), but lower than in the US – I suspect in part because the Republican charge of a politically manipulated housing market is truer in Australia than it is in the US.
Figure 5: Australia's correlation of mortgage acceleration and rising house prices (Correlation 0.62)
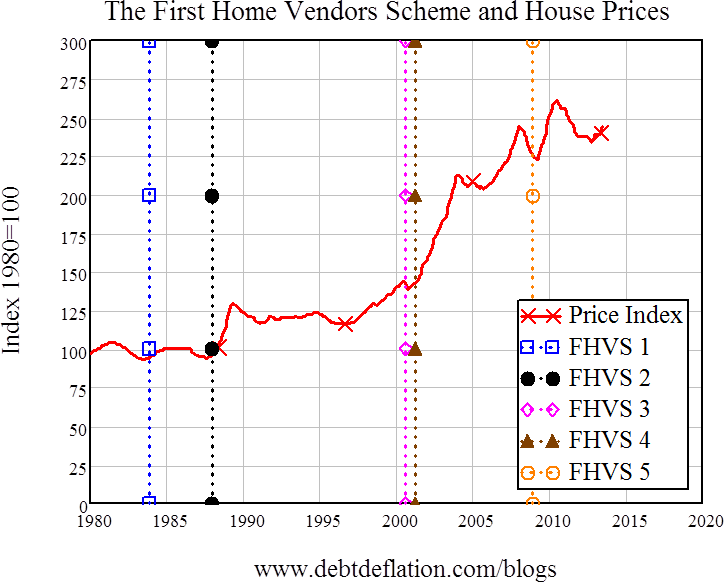
Since 1980, a plethora of schemes has been introduced whose side-effects – whatever were their professed direct aims – included propelling house prices ever higher, as government policy turbocharged the reborn Australian tendency for leveraged speculation. First Home Vendors Grants (as I prefer to call them), halving the capital gains tax rate, exempting the family home from capital gains, and allowing 100 per cent of new properties to be sold to non-residents – these government manipulations of the housing market are so pervasive that my first detailed report on Australia’s housing market in September 2010 was entitled ‘The Hand of Gov’, in a mock tribute to Maradona’s famous cheat “Hand of God” goal that robbed England in the 1986 World Cup.
Though existing home owners were the chief beneficiaries of these schemes, their primary aim when introduced was not favouring one social class (home owners) over another (renters), but macroeconomic stimulus. That is vividly apparent in the Minister’s speech in 1983, when the First Home Vendors Bill was introduced:
“FIRST HOME OWNERS BILL 1983
This Government was elected . . . with a commitment to boost the nation's economy . . . Our housing policies are an essential element of our national recovery strategy . . . Our program is designed to achieve the dual objectives of ensuring that housing plays a key role in our economic recovery and ensuring that Australian families can gain access to adequate housing at a price they can afford. The main elements of our program are . . . a new more effective scheme to assist low income home buyers-the first home owners’ scheme . . . to get the housing industry moving without delay we removed the savings requirement from the existing home deposit assistance scheme… (Australian Parliament 1983)”
The scheme certainly worked in its primary objective – stimulating the economy. But this was at the expense of its alleged secondary objective, of “ensuring that Australian families can gain access to adequate housing at a price they can afford”. The second (Keating), fourth (Howard) and fifth (Rudd) incarnations of the scheme set off obvious bubbles in house prices, each one building on the legacy of its predecessor (see Figure 4).
Figure 6: How to turbocharge house prices
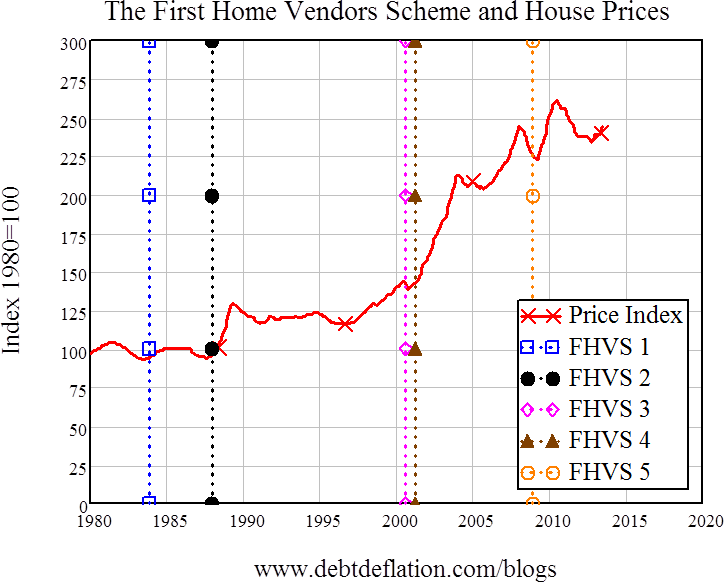
So the second key characteristic of the Australian market is that it’s one where government manipulation rules, rather than mere market forces. While this manipulation was initially aimed at macroeconomic stimulus, it has resulted in entrenched strong class interests in the housing market, with the favoured owners and landlords overwhelmingly more powerful than tenants.
This manipulation has been extraordinarily effective – both in its objective of short-term macroeconomic stimulus, and in spiking house prices. But it’s achieved the exact opposite of the secondary goal, which is the one given top billing when the politicians spin the public: boosting home ownership.
Steve Keen is author of Debunking Economics and the blog Debtwatch and developer of the Minsky software program.


