MARKETS SPECTATOR: Fully-stretched Shanghai ready to fire
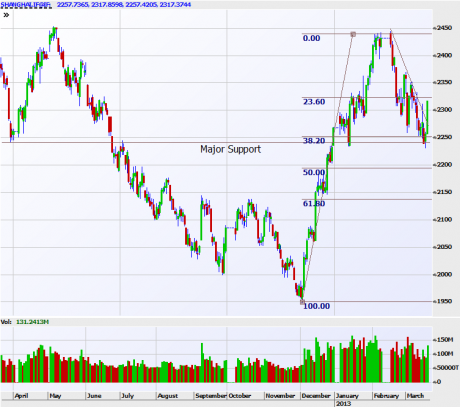
The Shanghai Composite looks to be in the process of forming a bottom after undergoing a textbook correction that saw it retreat about 8 per cent from recent highs.
Keeping this in perspective is the fact that since early December, it has surged more than 25 per cent as economic data showed very encouraging signs.
In the chart above, we can see that the Shanghai Composite has found strong buying interest around the major support level, which also coincides with the 38 per cent Fibonacci retracement mark. Yesterday’s 2.66 per cent gain came on a big pickup in volume, which is a very encouraging sign. Price action also broke up and closed above the short-term downtrend line, which indicates the bulls are regaining control and that recent momentum is turning to the upside.
This move coincided with a bullish forecast from famed Market Studies founder Tom DeMark. For more than 40 years, DeMark has been developing, trading and teaching his techniques to institutional professionals around the world.
Whether or not you believe in technical analysis, DeMark’s studies are among, if not the most, popular technical studies followed by the big institutions globally. Put simply, this means that a lot of ‘big money’ is watching and following these indicators, which has a significant impact on markets.
When it comes to the Shanghai Composite, his recent record is pretty damn good. According to an interview with Bloomberg, DeMark said on December 4 last year that the Shanghai Composite would climb as much as 48 per cent within nine months.
More recently, on February 6 he told Bloomberg that the Shanghai Composite would decline about 8 per cent to within a range of 2230 to 2250. And then a few days ago he wrote: “We are identifying a low-risk entry zone just beneath today’s (March 18) low of the Shanghai Composite which should be a bottom prior to the resumption of the advance.”
On top of this, the latest China HSBC Flash Manufacturing PMI reading released this morning was stronger-than-expected at 51.7 versus forecasts of 51.2. This follows a disappointing reading last month that saw some concerns reappear.
This latest result shows that the trend is definitely recovering and that last month’s figure is likely an aberration rather than something more sinister.
Also of interest is a serious of charts I found on zerohedge.com. They show that over the last three years the Shanghai Composite has acted as a leading indicator for a pullback in global markets, with the S&P 500 used as an example here.
Only time will tell whether this proves accurate again this year, but at the moment you would have to say its looking reasonably good given the pullback we’ve seen in Australian equities.
When it comes to the Shanghai Composite, he’s recent record is pretty damn good. According to an interview with Bloomberg, DeMark said on December 4, 2012 that the Shanghai Composite would climb by as much as 48 per cent within nine months.
More recently, on February 6 he told Bloomberg that the Shanghai Composite would decline about 8 per cent to within a range of 2230 to 2250. And then a few days ago he wrote “We are identifying a low-risk entry zone just beneath today’s (March 18) low of the Shanghai Composite which should be a bottom prior to the resumption of the advance”.
On top of this, the latest China HSBC Flash Manufacturing PMI reading released this morning was stronger-than-expected at 51.7 versus forecasts of 51.2. This follows a disappointing reading last month that saw some concerns reappear.
However, this latest result shows that the trend is definitely recovering and that last month’s figure looked to be an aberration rather than something more sinister.
Also of interest is a serious of charts I found on zerohedge.com. They show that over the last three years, the Shanghai Composite has acted as a leading indicator for a pullback in global markets, with the S&P 500 used as an example here.


