
Which is Australia's best insurer?


Recommendation


- {{x.value}}
{{ twilioFailed ? 'SMS Code Failed to Send…' : 'Enter verification code' }}

{{ completedStep1 ? 'Authentication & Security' : content.trialHeading.replace('{0}', user.FirstName) }}

{{ content.upgradeHeading.replace('{0}', user.FirstName) }}
The email address you entered is registered with InvestSMART
Please login to continue
We have sent you an email with the details of your registration.
Looks you are already a member. Please enter your password to proceed
{{ upgradeCTAText }}
Updating information
Please wait ...
Your membership to InvestSMART Group recently failed to renew.
Please make sure your payment details are up to date to continue your membership.
Having trouble renewing?
Please contact Member Services on support@investsmart.com.au or 1300 880 160
You've recently updated your payment details.
It may take a few minutes to update your subscription details, during this time you will not be able to view locked content.
If you are still having trouble viewing content after 10 minutes, try logging out of your account and logging back in.
Still having trouble viewing content?
Please contact Member Services on support@investsmart.com.au or 1300 880 160
Please click on the ACTIVATE button to activate your Intelligent Investor 15-day free trial
Please click on the ACTIVATE button to finalise your membership
Unsuccessful registration
Registration for this event is available only to Eureka Report members. View our membership page for more information.
Registration for this event is available only to Intelligent Investor members. View our membership page for more information.
- You are already registered for this event.
- This event is already full.
- Please select a quantity for at least one ticket.
- {{ i }}
Forgotten password
Please enter your email address below to request a new password
- Indepth analysis of ASX listed shares
- BUY, Hold and Sell Recommendations
- Ideas Lab
- Special Reports
- Alan Kohler’s Weekend Briefing
- Interviews with CEO’s & top influencers
- Money Cafe and Talking Finance
- Super Advice and Q&A with Ask Alan

When it comes to insurance, competition is everything. Insurance is different to many industries in that managers can make decisions today that only have consequences decades from now. Companies often get themselves into trouble by underpricing policies to boost short-term growth, but that can result in an excess of claims down the road. This slowly chips away at shareholder equity, and sometimes not so slowly. Knowing the good insurers from the bad is paramount to making sensible investments in this sector.
The Australian general insurance landscape is dominated by three insurers – QBE Insurance, Insurance Australia Group (IAG), and Suncorp. Here we'll focus on the two standalone general insurers, QBE and IAG. While Suncorp is the second largest insurer in Australia, half its income is from banking and life insurance, which is a completely different ballgame.
Key Points
-
QBE has more diverse products and geographies
-
IAG run more efficiently
-
Both offer fair value; slight preference for IAG
Let's use three criteria to compare IAG and QBE – operational differences, financial performance, and relative valuation.
Operational differences
The general pitch of financial advisors is that diversification is your friend. And when it comes to diversity, no insurer does it better than QBE.
With operations in North America, Europe, Asia, Australia and New Zealand – 37 countries in all – QBE is one of the world's 20 largest insurers (see Chart 1).
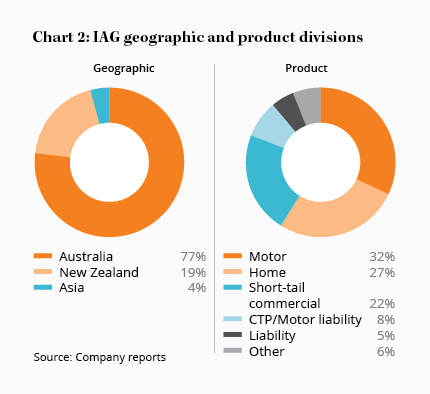
IAG, on the other hand, holds the dominant market position in Australia and New Zealand – with a market share of 27% – but it is almost entirely focussed on these mature markets (see Chart 2). Around 4% of the company's gross written premium (GWP) – an insurer's measure of revenue – is from Asia, but its investments overseas have been patchy at best.
Both companies' strategies have merit. IAG's focus on one particular region means stronger brand recognition, which translates into slightly more pricing power and less exposure to offshore risks. But QBE's diverse geographic operations mean a natural disaster in one particular area will be less disruptive.
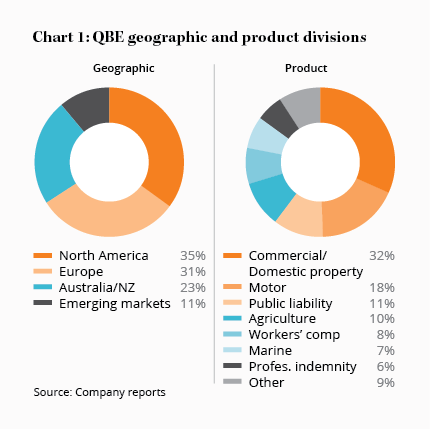 As for product diversity, QBE again wins out – but it's a double-edged sword. QBE will insure just about anything, with product lines running from simple car insurance to covering cargo ships against the risk of being captured by pirates.
Nearly all of IAG's business, however, is from less complex (and less risky) insurance, such as home and motor lines. These are known as ‘short tail' policies, where losses are known and paid soon after the event – a car crash or house fire, for example.
QBE has many more ‘long tail' contracts, where the eventual losses may not be known for many years. These policies – things like workers' compensation or public liability – are much harder to predict and often need to be settled in court.
Done well, long tail insurance lines can be more profitable, as we'll see in a moment, and the complexity adds a barrier to new competitors. Warren Buffett's Berkshire Hathaway has made tens of billions from ultra long tail policies that can span decades. Nonetheless, complex long tail policies carry an extra dose of risk; QBE wrote off US$600m of goodwill in 2013 largely due to underpriced long tail policies coming back to bite long after they were written.
Financial performance
When you take out an insurance policy, you pay a premium up front but generally only make a claim months or years later. In the meantime, the insurer gets to hold onto the money – which is known as ‘float' – and can invest it for the benefit of shareholders.
IAG and QBE have $6bn and US$15bn of float, respectively. Could this be another win for QBE? No. Over the past 10 years, QBE's float has shrunk 8%, while IAG's has grown 12%. Growth in float is one of the three main forces driving shareholder returns – the others being underwriting prowess and investment income, which is largely down to interest rates.
 Float is only valuable to shareholders if its cost is consistently below the cost of obtaining alternative sources of funding. If an insurer pays out more in claims each year than it earns in premiums – an underwriting loss – then that difference can be considered the cost to hold onto and invest policyholder money.
In analyst speak, the ‘combined ratio' is how we measure the cost of float. If the insurer has a bad year and pays out $105 in claims and related administration expenses, but takes in only $100 in premiums, it will have a combined ratio of 105%. That is, it made an underwriting loss.
If the company is making money from its insurance business – before adding the investment income earned on its float – then it will have a combined ratio below 100%.
Competition in the insurance industry is so strong that any level of profitability is rare, with most insurance operations being loss-making. The industry as a whole had a combined ratio of 105% over the past 15 years. As such, most insurers rely on investment income from their float to turn a profit.
So how do IAG and QBE score? Though there are peaks and troughs that coincide with high claims and bad weather, the Australian insurance oligopoly is surprisingly – or perhaps unsurprisingly – profitable.
IAG's combined ratio has averaged 96% over the past 15 years, while QBE managed an even more impressive 93%. Even after accounting for the large writedowns in 2013, QBE still has had an above-average level of profitability.
Not to be outdone, however, IAG has another ratio going for it. Pricing of risk is the single most important thing an insurer needs to get right but, in an industry as competitive as this one, running a tight ship is a close second.
To measure an insurer's efficiency, we turn to the expense ratio – the percentage of a company's premiums that went to underwriting expenses, including salaries, broker commissions, and marketing. Here, IAG takes the crown with an expense ratio of 26%, compared to 31% for QBE. Over the past five years, the difference has averaged almost 7% in favour of IAG, suggesting management has a keen eye for keeping expenses to a minimum.
Relative value
Even the best insurer will make a poor investment if you pay too much for its stock. As this notoriously cyclical industry has too many ups and downs to make any one year's earnings of much value, it's important to assess IAG and QBE's average earnings power.
Over the next five years, we expect IAG's dominant market position to generate a respectable return on shareholders' equity, which currently stands at $6.8bn. Management targets a return on equity (ROE) of 15% ‘through the cycle', but, for the sake of conservatism, let's knock that down to 11%, which is the company's 10-year average. That would equate to a normalised profit of $750m, or around 32 cents per share (consensus estimates are for the company to earn 35 cents per share in 2017).
At today's price of $5.95, that's a normalised price-earnings ratio of around 19 and 2.0 times book value, which also happens to be the stock's 10-year average. So you won't be surprised that we consider IAG to be fairly valued at current levels.
QBE has a book value of US$10.3bn and a long-term return on equity target of 13–15%. Here, though, the term ‘target' is used particularly loosely – the last time QBE actually achieved that return on equity was in 2010; QBE only managed an ROE of 8% in 2016.
Let's assume QBE's ongoing US$350m cost-cutting program brings the company's ROE back up to its 10-year average of 10%. If that's the case, normalised net profit is around $1.3bn given current exchange rates, or around 98 cents per share (consensus estimates are for 82 cents in 2017).
That puts QBE on a normalised price-earnings ratio of 13 and price-to-book ratio of 1.3. A steal, right?
Not so fast. Remember those riskier insurance policies mentioned above? Profitability can be much more volatile and QBE's exposure to large natural catastrophes means any investment deserves an extra dose of caution. What's more, given its riskier polices, QBE invests 90% of its portfolio in cash and short-term fixed interest securities, which only earn a pittance given today's low interest rates. That reduces the value of QBE's float.
Ultimately, IAG's less risky policies, efficiency-focused management, and dominant – and growing – market share in the stable Australian market are worth paying a premium for. Both companies trade within our range of fair values, though IAG is slightly closer to our recommended Buy price of $4.50 than QBE is to its Buy price of $8.50. For both companies, we continue to recommend you HOLD.
Recommendation