
Sticking with Servcorp


Recommendation


- {{x.value}}
{{ twilioFailed ? 'SMS Code Failed to Send…' : 'Enter verification code' }}

{{ completedStep1 ? 'Authentication & Security' : content.trialHeading.replace('{0}', user.FirstName) }}

{{ content.upgradeHeading.replace('{0}', user.FirstName) }}
The email address you entered is registered with InvestSMART
Please login to continue
We have sent you an email with the details of your registration.
Looks you are already a member. Please enter your password to proceed
{{ upgradeCTAText }}
Updating information
Please wait ...
Your membership to InvestSMART Group recently failed to renew.
Please make sure your payment details are up to date to continue your membership.
Having trouble renewing?
Please contact Member Services on support@investsmart.com.au or 1300 880 160
You've recently updated your payment details.
It may take a few minutes to update your subscription details, during this time you will not be able to view locked content.
If you are still having trouble viewing content after 10 minutes, try logging out of your account and logging back in.
Still having trouble viewing content?
Please contact Member Services on support@investsmart.com.au or 1300 880 160
Please click on the ACTIVATE button to activate your Intelligent Investor 15-day free trial
Please click on the ACTIVATE button to finalise your membership
Unsuccessful registration
Registration for this event is available only to Eureka Report members. View our membership page for more information.
Registration for this event is available only to Intelligent Investor members. View our membership page for more information.
- You are already registered for this event.
- This event is already full.
- Please select a quantity for at least one ticket.
- {{ i }}
Forgotten password
Please enter your email address below to request a new password
- Indepth analysis of ASX listed shares
- BUY, Hold and Sell Recommendations
- Ideas Lab
- Special Reports
- Alan Kohler’s Weekend Briefing
- Interviews with CEO’s & top influencers
- Money Cafe and Talking Finance
- Super Advice and Q&A with Ask Alan

Almost 50 different articles by no fewer than five different analysts. That's the sum of our coverage of serviced office provider Servcorp in the 11 years since we first recommended the stock in 2005 at $2.60. The stock doubled in its first year following that recommendation, before giving it all back (and more) in the global financial crisis and rising almost fourfold since, to today's record high of $8.19.
Key Points
-
Quality company growing quickly
-
USA still making losses
-
Increasing price guide
Through all that, we've never said Sell – and we're not about to start now.
Premium quality
Servcorp's business is a fairly easy one to understand. The company rents floors in some of the world's most prestigious office buildings on long-term leases, divides up the space and then sub-lets it to tenants for a monthly fee. In return, tenants get plush meeting rooms, a receptionist, full IT support, and – last but not least – a fancy address.
It's a simple formula and one that Servcorp has perfected. From the moment they sign a lease, a team will fit-out the office using similar layout, fittings and IT equipment to the other 150 floors that are located in 22 countries around the world (see Chart 1). It's the office equivalent of your computer's copy and paste function.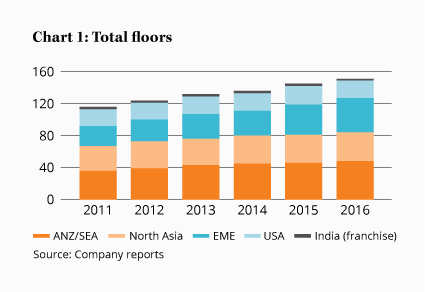
Despite the cookie-cutter approach, Servcorp's interior design is luxurious and, along with its premium locations and support, this allows the company to attract higher quality tenants than the cash-poor tech start-ups that many of its competitors covet.
Position of strength
The benefit of attracting these higher quality tenants – apart from the fact they tend to stay in business for longer – is that you can make more money.
In the 2016 financial year, Servcorp's earnings before interest, tax, depreciation and amortisation margin of 22% was higher than industry giant Regus at 16% or the 3% that venture capital darling WeWork disclosed in a recently leaked letter.
In a competitive and cyclical industry such as Servcorp's, where demand will rise and fall along with the worldwide economy, earning a bit more than competitors allows more room to cut costs to maintain occupancy when things go bad.
A like-for-like story
A key metric to follow with Servcorp are its like-for-like figures, which measure only the performance of floors open in both the current and previous financial year.
New floors will typically take 12–18 months to become profitable as the company incurs the cost of leasing the property from day one but it needs fitting out and, even after that, its sales team starts with occupancy at zero. New floor losses, which amounted to just under $8m in 2016, can't be ignored, but management has a great track record of turning these losses into profits. The like-for-like figures, meanwhile, provide a better indication of how the mature business is travelling.
In 2016, like-for-like occupancy fell 2 percentage points to 77% after two years of reporting like-for-like occupancy of 79%. Total occupancy for the company also fell to 75% from 76%. Occupancy is a major driver of profit growth as it dictates revenue which, with a high fixed cost base, will mostly flow straight through to profit.
Whilst the fall in occupancy isn't a good look, it didn't appear to hurt much in the last financial year. In a sign that Servcorp was able to charge higher rents, like-for-like profit before tax actually increased 37% to $57m.
What's happening in the world?
More than 80% of Servcorp's revenue comes from outside Australia and New Zealand, making it a truly global business (Table 1).
| ($m) | 2013 | 2014 | 2015 | 2016 | |
|---|---|---|---|---|---|
| ANZ/SEA | Revenue | 75 | 79 | 81 | 87 |
| NPBT | 13 | 11 | 9 | 12 | |
| North Asia | Revenue | 69 | 78 | 89 | 105 |
| NPBT | 11 | 12 | 18 | 21 | |
| EME | Revenue | 43 | 59 | 73 | 93 |
| NPBT | 5 | 11 | 16 | 19 | |
| USA | Revenue | 12 | 19 | 25 | 35 |
| NPBT | (6) | (3) | (5) | (4) | |
| Total | Revenue | 200 | 234 | 269 | 321 |
| NPBT | 24 | 31 | 37 | 48 | |
Out of all its locations, the biggest problem is the USA, which is still yet to report a full-year profit since opening its first floor in 2010.
While the 66% decline in the total loss to $3.8m and revenue growth of 42% are encouraging, occupancy still trails the rest of the business.
With the division now more than 5 years old and many of its floors mature, we were hoping for better news. We will be eager to hear more information about what the company expects to do with the US at its upcoming AGM.
Staying put
Servcorp expects to open at least four new floors in 2017 and, with only token external debt and almost $100m in cash, it's well placed to take advantage of further opportunities.
Management's guidance is for another year of double-digit profit growth, with profit before tax expected to rise 15% to $56m, which should lead to earnings per share of around 46–47 cents. The company expects to keep dividends steady at 22 cents per share for the third year in a row, pushing the payout ratio down from 54% to 49%. This is a company focused on growth.
The guidance puts Servcorp on a forward price-earnings ratio of 18, or closer to 15 if you strip out the cash balance. That's not expensive for such a high-quality business that offers excellent long-term growth prospects although, given its cyclicality, we'd need a greater margin of safety before upgrading again. Our price guide, though, has been left behind by the company's growth and we're bumping up our Buy price to $6.50 (from $5) and our Sell price to $11.00 (from $8). HOLD.
Recommendation