
Portfolios perform well in face of political instability


- {{x.value}}
{{ twilioFailed ? 'SMS Code Failed to Send…' : 'Enter verification code' }}

{{ completedStep1 ? 'Authentication & Security' : content.trialHeading.replace('{0}', user.FirstName) }}

{{ content.upgradeHeading.replace('{0}', user.FirstName) }}
The email address you entered is registered with InvestSMART
Please login to continue
We have sent you an email with the details of your registration.
Looks you are already a member. Please enter your password to proceed
{{ upgradeCTAText }}
Updating information
Please wait ...
Your membership to InvestSMART Group recently failed to renew.
Please make sure your payment details are up to date to continue your membership.
Having trouble renewing?
Please contact Member Services on support@investsmart.com.au or 1300 880 160
You've recently updated your payment details.
It may take a few minutes to update your subscription details, during this time you will not be able to view locked content.
If you are still having trouble viewing content after 10 minutes, try logging out of your account and logging back in.
Still having trouble viewing content?
Please contact Member Services on support@investsmart.com.au or 1300 880 160
Please click on the ACTIVATE button to activate your Intelligent Investor 15-day free trial
Please click on the ACTIVATE button to finalise your membership
Unsuccessful registration
Registration for this event is available only to Eureka Report members. View our membership page for more information.
Registration for this event is available only to Intelligent Investor members. View our membership page for more information.
- You are already registered for this event.
- This event is already full.
- Please select a quantity for at least one ticket.
- {{ i }}
Forgotten password
Please enter your email address below to request a new password
- Indepth analysis of ASX listed shares
- BUY, Hold and Sell Recommendations
- Ideas Lab
- Special Reports
- Alan Kohler’s Weekend Briefing
- Interviews with CEO’s & top influencers
- Money Cafe and Talking Finance
- Super Advice and Q&A with Ask Alan

It's been said that markets climb against a wall of fear and it's rarely been more true than in the 2017 financial year.
Crucial elections were held around the world, in Italy, the Netherlands, the US, the UK and France. Results were mixed, but the US and UK produced major shocks. There were of course no elections in North Korea, but the rogue state served up its own brand of instability.
Markets took it all in their stride, though – even managing to turn Donald Trump's election as US president into a positive, which must be the purest form of seeing a glass as half-full. The high prices that have ensued have caused their own problems, with good opportunities thin on the ground.
Key Points
-
Despite political surprises, markets perform well
-
Opportunities thin on ground
-
Portfolios' performance respectable
Quality, undervalued stocks
In the face of such difficulties, the best response for long-term investors – as ever – is to seek the sanctuary of a bunch of decent-quality and undervalued stocks. That's largely what our portfolios have done over the past year (much like the year before in fact) and by and large it's turned out OK (see Table 1).
A run down the list of holdings of both portfolios shows (with only a few exceptions) a collection of cash-generative companies, with competitive advantages in important areas. While the market might fret about the near-term prospects for stocks like ASX, Ansell, Computershare, Seek and Sydney Airport, we're happy to back their ability to deliver a growing stream of cash over the long term.
| Period to 30 June 2017 | 1m (%) |
3m (%) |
1 year (%) |
since incep. (%pa)* |
|---|---|---|---|---|
| Growth Portfolio | 0.9 | 3.1 | 12.9 | 12.5 |
| Equity Income Portfolio | 1.1 | 2.9 | 17.5 | 14.3 |
| S&P/ASX 200 Accumulation Index | 0.2 | –1.6 | 14.1 | 7.1 |
| * 1 July 2015 | ||||
| **Performance is shown after investment and admin costs | ||||
Of course such businesses don't grow on trees, and it's even harder to find them at bargain prices. So once we've bought them we tend to hold onto them – at least until we find something demonstrably better. This was the case recently, for example, with the shift of some of our holdings in Computershare into a new position in Navitas.
Too much tinkering, though, will hurt your returns. Most obviously there's a cost in terms of brokerage and taxes; more insidiously, though, it can suck you into the market's short-term thinking and thereby negate the biggest advantage you can give yourself.
Low turnover
During the year, we've sold and reinvested a bit less than 20% of each portfolio. That's in line with the previous year and implies an average holding period of about five years, which is about what we'd expect in the future.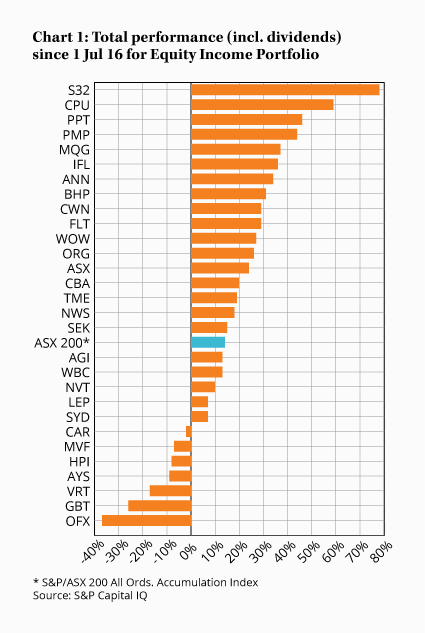
Although the portfolios have a bias towards quality (the long-term merits of which are often undervalued), markets are dynamic and offer different types of opportunity at different times. We therefore try to be flexible in our approach and will buy any kind of stock so long as we think it's sufficiently undervalued.
Examples of lesser quality stocks include PMP in the Equity Income Portfolio and Fleetwood in the Growth Portfolio, both of which have served us well. PMP has returned 47% since our purchase in 2015 (including 44% over the past year), while Fleetwood has returned 41% on average since our two purchases in 2014 and 2015 (including 25% over the past year).
In the Growth Portfolio in particular, we'll also invest in more speculative situations, within tight portfolio limits. As you'd expect, the experience here has been mixed, with Nanosonics up more than threefold since it was added to the (then model) Growth Portfolio at 78.5 cents in 2014 (and up 16% over the past year) and iCar Asia down 73% since it was added at 96.5 cents in 2015 (and down 67% over the past year).
Mistakes, we've made a few
We've also had some situations that have turned out to be more speculative and/or lower quality than expected – to put it politely – a category that would include GBST Holdings and OFX Group. In both cases we overestimated the quality and overpaid, but in GBST's case we think the basic investment case is still on track and have held on, while with OFX we've taken what's left of our money and run.
In GBST's case we've now made a loss of 36% (29% over the past year) for the Growth Portfolio and 30% (29% over the past year) for the Equity Income Portfolio.
With OFX, we got out with a loss of 30% in both portfolios (incorporating a loss of 37% in the past year).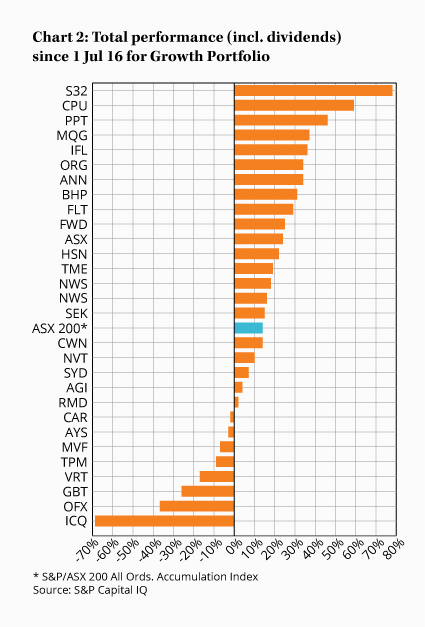
Overall, though, such mistakes have been relatively few in number. The Growth Portfolio has lost money on seven of the 31 stocks it's held over the past two years (since it's been accepting real money), and the losses on three of those are in single digits. The Equity Income Portfolio has lost money on only five stocks out of 33 (with two of those in single digits). The one double-digit loss not already mentioned was in Origin Energy which lost 16% in the Equity Income Portfolio and 14% in the Growth Portfolio before being sold this year.
These losses have been more than offset by gains on stocks like Trade Me (up 35%), South32 (up 23% in the Growth Portfolio and 46% in the Equity Income Portfolio), ASX (up 23%) and Sydney Airport (up 21%), which have combined healthy gains with larger weightings to deliver the greatest dollar gains in both portfolios. (See Charts 1 and 2 for a breakdown of returns for each portfolio over the past year.)
Of course these performances have been helped by a buoyant sharemarket, with the S&P/ASX 200 Accumulation Index returning 14.1% over the past year and 7.1% per year over the past two. However, our portfolios have more than matched this, with the Growth Portfolio up by 12.9% over one year and 12.5% per year over two, and our Equity Income Portfolio up by 17.5% over one year and 14.3% per year over two (after costs – see Table 1 for performance details).
Since the portfolios began as models in July 2001 they've returned 9.4%* a year (Growth) and 12.5%* a year (Equity Income), after assumed costs of 0.97% a year (matching the real costs since 2015), compared to 7.9% and 8.0% a year, respectively, for the index.
* A previous version of this article incorrectly stated these returns to be 9.5% (Growth) and 12.6% (Equity Income). Please see the comments below this article for an explanation.
Note: The Intelligent Investor Growth and Equity Income portfolios own shares in many of the stocks mentioned. You can find out about investing directly in Intelligent Investor and InvestSMART portfolios by clicking here.
Disclosure: The author owns shares in amaysim, GBST, iCar Asia, Nanosonics, Seek and Trade Me.