Instreet Link DPA - The worst of all worlds
Key Points
- This is a high risk, highly leveraged product with capped returns
- Even if the ASX 200 outperforms you may not get all your capital back
- Notional leverage makes it inefficient from a tax perspective
The Product
The latest release of the Instreet Link Deferred Purchase Agreement (DPA) (‘Instreet Link’) offers investors the potential to benefit from growth in the underlying index, at least that’s the pitch. We’ll focus on Series 43 but many of the principles apply equally to other variants of the product.
Instreet Link is tied to the performance of the S&P/ASX 200 Price Return Index, which tracks the share price movements of the top 200 ASX listed companies by market capitalisation.
This is how it works: You buy a unit for an estimated upfront price of $1.45. Each unit offers notional exposure to $10 invested in the Index.
Where does the additional $8.55 come from? It’s ‘notional debt’, which means your capital is effectively leveraged seven times over.
There are a few other key elements of the product worth understanding: It runs for a two-year term only; If the Index returns over 30% in that period, you won’t get to see the additional benefit because your returns are capped at 30%; Those returns are calculated by averaging the opening and closing levels of the Index over three months; And you can withdraw early by way of a ‘buy-back’ of your investment but you bear the cost of all the upfront fees and unwind costs.
Speaking of fees, they’re hefty. Up to 2% to your adviser and 1.5% to Instreet based on the notional exposure amount. Based on the unit price – the amount you invest - that’s up to 24% disappearing in fees rather than being invested.
As for your returns, the payout on each $1.45 unit is calculated by multiplying the percentage performance of the Index by your $10 notional exposure.
That all seems fairly straightforward, but it has a rather nasty consequence: The index must rise by 14.5% over the two year period in order for you to get your money back (the Break Even Level). If the index rose by just 5% a year—10% for the period of investment—you’d lose about a third of your capital. If it didn’t rise at all, you’d lose everything.
Breaking down the ‘features’
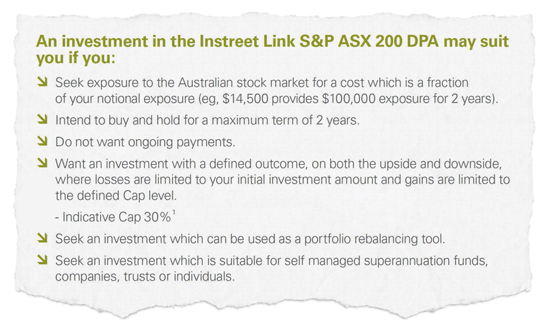
The flyer promoting this product contains a section that looks like this:'

Marketing really is a different language, so let’s break it down and explain what each ‘feature’ really means:

Translation: This product is leveraged
Instreet Link has been designed to enable SMSFs to invest with leverage. But the leverage in this product is simply frightening.
Remember the leverage is so high that if the Index remains flat for the two-year term, you lose all of your investment. If it performs in line with historical averages (see below), you lose a good chunk of it.

Translation: It’s too expensive to offer you anything other then a short-term product
Financial advisers usually tell their clients they should invest in equities with a 5-to-10 year time horizon. The problem is that the derivatives on which these equity products are based either aren’t available or are too expensive over that time frame. That’s why it runs for only two years.
Apparently, a 2% upfront fee for your advisor and another 1.5% to Instreet is sufficient incentive for them to dispense with one of the shibboleths of the profession.

Translation: We’re excluding a key component of overall returns
This product is described as equities linked but suffers from the same problem as capital guaranteed and other derivatives based products. You don’t get paid dividends. That’s really important.
Remember that the Index in this case is the price return index, not the total return (known as the Accumulation) Index. Chart 1 highlights the importance of this difference.
For the decade to 31 December 2011, accumulated dividends contributed more to total returns from the ASX 200 than share price increases. In fact, the ASX 200 Price Return Index has averaged only 2% per annum, far from the 14.5% required over two years to break-even on Instreet Link.
If the ASX 200 performance is broken down by calendar years (see Table 1) you can see that achieving the ‘break-even’ 14.5% return would have, over the last decade, been the exception.
| Calendar year ending | ASX 200 (open) | ASX 200 (close) | Annual performance (%) | 2yr performance (%) |
|---|---|---|---|---|
| 31-Dec-02 | 3,422 | 3,007 | -12.30 | |
| 31-Dec-03 | 3,007 | 3,300 | 9.73 | -3.58 |
| 31-Dec-04 | 3,300 | 4,051 | 22.75 | |
| 31-Dec-05 | 4,051 | 4,763 | 17.60 | 44.35 |
| 31-Dec-06 | 4,763 | 5,670 | 19.03 | |
| 31-Dec-07 | 5,670 | 6,340 | 11.82 | 33.10 |
| 31-Dec-08 | 6,340 | 3,722 | -41.29 | |
| 31-Dec-09 | 3,722 | 4,871 | 30.85 | -23.17 |
| 31-Dec-10 | 4,871 | 4,745 | -2.57 | |
| 31-Dec-11 | 4,745 | 4,057 | -14.51 | -16.71 |
| Average | 4.13 | 6.80 |
Including accumulated dividends may not have increased the number of times investors achieved breakeven but it would have increased the overall payout.
Investing in the ASX 200 Price Return Index may feel like share investing, taste like share investing, and even smell like share investing but, without dividends, it’s not.

Translation: It’s too expensive to provide you with all the upside so we capped it
The philosophy of aggressive investing (small caps, venture capital, futures trading etc) is that you put an amount at risk in the hope that you will multiply your investment many times over. All up, the many dud investments are more than compensated for by the successes. That’s the idea at least.
But with this product’s performance cap you don’t get the chance to turn $1.45 into $5 or $10. In fact you are capped at $3. Let’s rework Table 1 with a 30% performance cap applied:
| Calendar year ending | ASX 200 (open) | ASX 200 (close) | Annual performance (%) | 2yr performance (%) | 2yr performance (capped at 30%) |
|---|---|---|---|---|---|
| 31-Dec-02 | 3,422 | 3,007 | -12.13 | ||
| 31-Dec-03 | 3,007 | 3,300 | 9.73 | -3.58 | -3.58 |
| 31-Dec-04 | 3,300 | 4,051 | 22.75 | ||
| 31-Dec-05 | 4,051 | 4,763 | 17.60 | 44.35 | 30.00 |
| 31-Dec-06 | 4,763 | 5,670 | 19.03 | ||
| 31-Dec-07 | 5,670 | 6,340 | 11.82 | 33.10 | 30.00 |
| 31-Dec-08 | 6,340 | 3,722 | -41.29 | ||
| 31-Dec-09 | 3,722 | 4,871 | 30.85 | -23.17 | -23.17 |
| 31-Dec-10 | 4,871 | 4,745 | -2.57 | ||
| 31-Dec-11 | 4,745 | 4,057 | -14.51 | -16.71 | -16.71 |
| Average | 4.13 | 6.80 | 3.31 |
See what happens to your average returns? Performance caps are about improving the issuer’s profitability, not yours.

Translation: We want to sell to as many punters as possible but you bear the cost of us doing so
Structuring the investment with notional (rather than actual) leverage means it can be marketed to all types of investors, including SMSFs. This is great for sales but the downside is that it’s inefficient tax-wise.
With a geared share portfolio you have an actual loan with interest expense offsetting dividend income. Effectively, your interest expense is deducted at your marginal tax rate.
But in this case the ‘notional interest’ is the 14.5% you have to beat before you get a positive return. Effectively, this interest is being deducted from your capital gain – a capital gain likely to be taxed at concessional (half) rates. For an individual on the top marginal tax rate this is a 23.25% cost.
For those investing through an SMSF the inefficiency of this product is less of an issue (super capital gains only get a 5% discount – 10% tax rate vs 15% for ordinary income). But then leverage in the low tax environment of a SMSF doesn’t make much sense, full stop (more on that down the track).
Is there a place for this product?
If there is we can’t find it. If you hold a large proportion of safe assets (such as cash and bonds) then it can make sense to take a leveraged punt with a small amount. But a capped investment in the index is a poor way to do it.
Is there an alternative strategy?
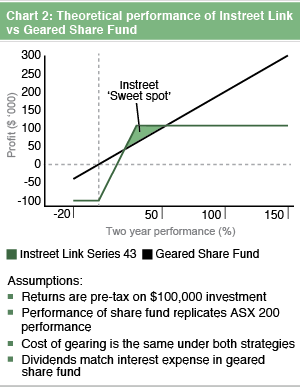
This product has been designed with a ‘sweet spot’ in mind—the 30% cap—and will perform well at that level or just below it. This is simply a function of the leverage.
Away from this sweet spot it will crash and burn. At lower levels of return the product will under-perform less leveraged investments and at higher levels you get capped out and miss out on substantial gains. The Chart 2 shows the theoretical performance of Instreet Link versus a geared share fund with 50% leverage.
Chart 2 shows how the geared share fund, with less leverage and no cap, will outperform Instreet Link at both lower and higher levels of return.
If you want to speculate with a small portion of your portfolio, this is a better alternative. You might also consider small cap stocks, venture capital or similar investments. Or invest in a start up. At least you then have the chance to multiply your investment many times over.
Finally, this product is the economic equivalent of a 'bull-call spread', an advanced option trading strategy.
If you really want to trade options—and we’re not recommending it—doing so directly would be far more preferable than through this structured product.
The verdict
Sensible investors seek out opportunities that offer limited returns with low risk or uncapped high risk returns. This product offers limited returns, high leverage and high risk. It’s the worst of all possible worlds.
VERDICT: STAY WELL CLEAR.


