
Home truths for the big banks


- {{x.value}}
{{ twilioFailed ? 'SMS Code Failed to Send…' : 'Enter verification code' }}

{{ completedStep1 ? 'Authentication & Security' : content.trialHeading.replace('{0}', user.FirstName) }}

{{ content.upgradeHeading.replace('{0}', user.FirstName) }}
The email address you entered is registered with InvestSMART
Please login to continue
We have sent you an email with the details of your registration.
Looks you are already a member. Please enter your password to proceed
{{ upgradeCTAText }}
Updating information
Please wait ...
Your membership to InvestSMART Group recently failed to renew.
Please make sure your payment details are up to date to continue your membership.
Having trouble renewing?
Please contact Member Services on support@investsmart.com.au or 1300 880 160
You've recently updated your payment details.
It may take a few minutes to update your subscription details, during this time you will not be able to view locked content.
If you are still having trouble viewing content after 10 minutes, try logging out of your account and logging back in.
Still having trouble viewing content?
Please contact Member Services on support@investsmart.com.au or 1300 880 160
Please click on the ACTIVATE button to activate your Intelligent Investor 15-day free trial
Please click on the ACTIVATE button to finalise your membership
Unsuccessful registration
Registration for this event is available only to Eureka Report members. View our membership page for more information.
Registration for this event is available only to Intelligent Investor members. View our membership page for more information.
- You are already registered for this event.
- This event is already full.
- Please select a quantity for at least one ticket.
- {{ i }}
Forgotten password
Please enter your email address below to request a new password
- Indepth analysis of ASX listed shares
- BUY, Hold and Sell Recommendations
- Ideas Lab
- Special Reports
- Alan Kohler’s Weekend Briefing
- Interviews with CEO’s & top influencers
- Money Cafe and Talking Finance
- Super Advice and Q&A with Ask Alan

Perhaps no topic causes more debate among Australians than house prices. As US-based investor Jeremy Grantham – one of many to have called 'bubble' on Australian property – put it:
“Tell a European you think there’s a housing bubble and you’ll have a reasonable discussion.”
Key Points
-
Property loans are a key risk
-
Mortgage loan performance is sound
-
Banks have buffers in a property downturn
-
Regulatory action has increased bank resilience
“Tell an Australian and you’ll have World War III.”
That was in 2012 and house prices have moved up significantly since. Sydney and Melbourne have experienced growth averaging about 10% a year. The longer-term trend shows house prices have easily outpaced wages as well (see Chart 1).
The boom
The rise of house prices is due to several factors, though unpacking individual contributions is tricky.
Low interest rates have pushed down rental yields and mean that people can afford larger mortgages. Population growth, underdevelopment (with restrictive rules), tax policies and increasing borrower debt burden have all played a part (see Chart 2). As has unbroken economic growth for over 25 years.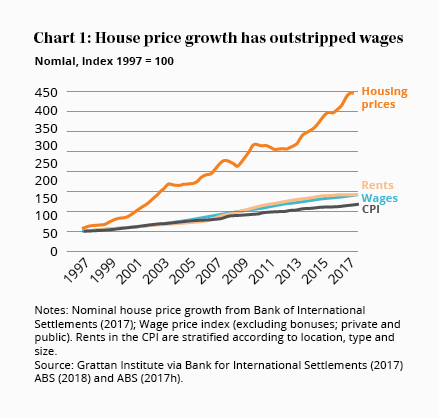
Banks have been major beneficiaries. Earnings from mortgage lending have been the primary source of the major banks’ extraordinary profitability over the past two decades – bad debts have been low and margins have been fat (even though associated net interest margins have declined).
It’s been a great time for major banks, but the future may not resemble the past. And with home loans now accounting for over 60% of their loan books, their prospects are now more than ever tied to the housing market.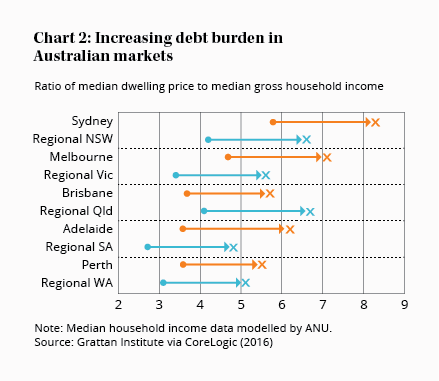
Many investors would say that’s a bad thing considering property prices and fears of a crash.
Major crash unlikely
Believers in a significant property downturn have plenty of data to support their case. Property looks expensive on virtually every measure. Australian households are now among the world’s most indebted (see Chart 3). That combination would suggest less upside for house prices at the very least.
However, while property prices look expensive, the typical preconditions for a steep nationwide property downturn – widespread lax lending standards and a rampant oversupply of housing – are not evident.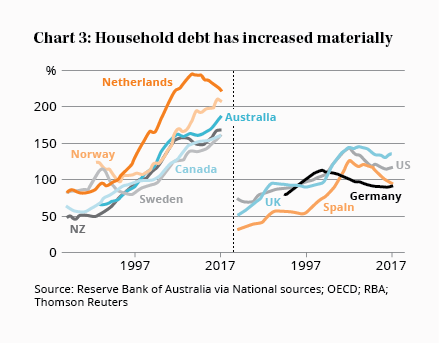
Higher interest rates and/or unemployment might also trigger a downturn, but neither appear imminent.
Tighter lending restrictions are another danger sign – and have in fact been been observed recently. This may explain why the housing market has seen some price declines in the last six or so months. Lending conditions are likely to tighten further but predicting the impact on house prices is difficult.
Resources weakness
The trajectory of house prices is usually determined by local conditions, and there’s been weakness recently in areas with significant mining activity, and perhaps pockets within cities (there is a concern that central Brisbane is oversupplied with apartments). But major banks can withstand such gyrations due to their lending diversification across the country.
At present, home loans are performing well overall. Areas exposed to resources such as Western Australia and Queensland have weaker repayment data (and are the main reasons for the recent increase in non-performing home loans shown in Chart 4) but remain under control. Home repossessions overall appear to be at 15-year lows. And repayments are ahead of schedule in the majority of cases.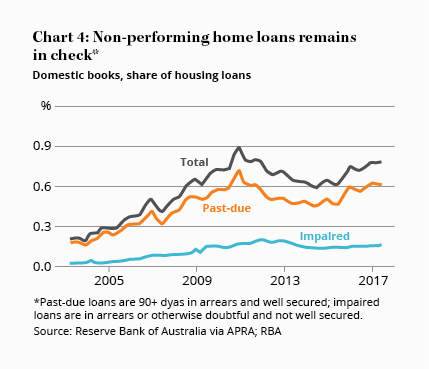
The factors that led to the housing boom also remain largely in play, except for the ability of borrowers (in aggregate) to take on a greater debt burden.
Low interest rates are supporting affordability and have helped many households to pay down their mortgages ahead of schedule. Property development has been catching up with housing demand but needs to remain high to meet expected immigration. And as we detail later, loan quality is improving.
So, conditions are sound for bank profits, but things can change quickly. Unemployment and development trends can go awry, interest rates can go up and prices can fall. Recessions happen – even in Australia!
Regulators act
And that worries regulators, particularly in light of the high levels of household debt. With their mandate of protecting depositors and maintaining the stability of the financial system, they have acted.
In recent years, regulators have imposed stricter lending standards, limits on classes of property loans (such as investor and interest-only), and required banks to hold more capital. Further revisions to mortgage risk weights are on the way. These actions have no doubt helped to taper house price growth.
Regulation has meant that banks are taking on less risk for new loans (notwithstanding the levels of house prices). The proportion of home loans written with low deposit levels (say 20% and under) is declining. Investor loans – viewed as riskier than loans to owner-occupiers – are lower as a proportion of the total loan book. Bank participation in ‘low-doc’ lending (borrowers that are not considered as prime) is virtually non-existent.
Last week, APRA announced that it would end its cap on investor loan growth. It came with a caveat: banks had to assess such loans with a high degree of scrutiny.
A flow-on effect of tighter regulation is that properties coming to the market (either new developments or existing homes) face a tougher time being sold. The unintended consequences are not fully clear at this stage.
Buffers in place
There’s little doubt, though, that banks are more resilient to a housing downturn than they have been in the recent past. Regulators can’t totally remove risk, and prior loans under various lending criteria remain on the banks’ books. But a closer look at the major banks’ mortgage portfolios reveals there are some buffers in place.
The starting point for assessing home loans is that they are ‘collateralised’, meaning the house itself can be used by the bank to recoup its dues.
Banks lend relative to the market value of the property, referred to as a loan-to-value ratio (LVR). Generally, the higher the LVR the riskier the loan. The LVR of any home loan alters over time as a mortgage is paid down, and the house price changes. Rising home values and repayments reduce the LVR and increase the safety buffer for banks. A price decline can have the opposite effect.
On current LVRs, the majors have buffers with most of their portfolio below 60% (the average is around 50% or lower). Chart 5 shows our estimations of LVR distribution (note that comparisons are complicated by differing methods of calculation and presentation between the banks). The tail (LVR above 80%) is more important as that would be the likely source of losses. 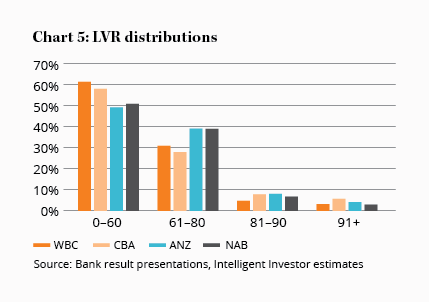
A hypothetical 10% decline in house prices would likely put around 5% of each of the Big 4’s mortgage accounts below or close to market values. A 20% price drop would account for around 8–14%.
The banks are exposed to significant potential losses in these scenarios, considering the combined mortgage loan book is over $1.4tn. But the reality is that losses don’t accumulate simply because the market value of a home is below the outstanding mortgage. The majority will pay their mortgage – people still need a place to live and borrowers cannot walk away from their mortgage debts in Australia.
A small proportion will be unable to repay, and a bank may need to repossess and sell the house. That exposes the bank to losses. The more who default, and the greater the house price decline, the larger the potential losses for banks.
At that stage, banks have several options to maintain their capital and minimise overall losses. They can raise interest rates, reduce new lending, and/or cut costs and dividends.
Stress test
Our hypothetical scenarios are simplistic but highlight the mechanics of losses. Banks undertake a more rigorous approach, known as stress tests, where they run scenarios involving house price declines and unemployment spikes. The outcomes of those tests suggest the major banks would take a hit in any downturn, but not enough to threaten their viability.
| Outcomes ($m) | Total | Year 1 | Year 2 | Year 3 |
|---|---|---|---|---|
| Stressed losses | 4,165 | 755 | 1,296 | 2,114 |
| Insured losses | 1,073 | 207 | 338 | 528 |
| Net losses | 3,092 | 548 | 958 | 1,586 |
| Net losses (bpts) | 61.5 | 10.8 | 18.7 | 32.0 |
| Probability of default (%) | N/A | 1.0 | 1.8 | 2.5 |
Take, for example, CBA’s stress test results, shown in Table 1. In a scenario where house prices drop 31% and unemployment reaches 11%, it points to losses totaling over $3bn over three years. CBA estimates that less than 2.5% of accounts would default each year, and that net losses over the three years would amount to 61.5 basis points (that is 0.615%) of the average outstanding mortgage balance.
For context, CBA’s mortgage losses have been around 1–3 basis points of average gross loans from 1983 to 2017 (Chart 6). That’s less than around 5 basis points of average home loans over that period on our estimates.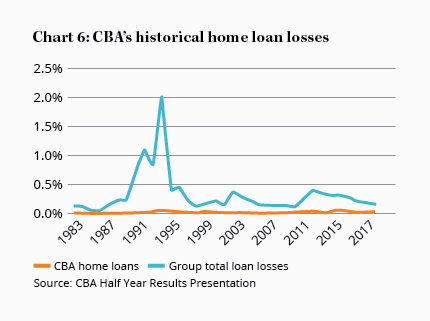
Stress tests also reveal protection from residential mortgage losses from lenders’ mortgage insurance (LMI). Regulated by APRA, LMI is typically utilised by all banks for mortgages with an LVR above 80% at origination. While the costs are borne by the mortgage holders, the bank is protected from losses on insured properties – in theory at least (a major crisis might threaten the viability of the insurers, bringing this assumption into question).
Overall, stress tests reveal potential mortgage losses are manageable. But it should be viewed with caution as reality can differ significantly from forecasts. And in all likelihood, housing stress would coincide with corporate loans turning sour and pressures on bank funding costs.
Maintaining standards
Whatever the collateral, banks will assess applicants’ ability to repay their mortgages by reviewing their disposable income levels (among other considerations).
Discipline is important as poor lending standards will lead to bad loans. Assessing the prudence of lending can be difficult from the outside, particularly as lending policies can weaken and strengthen based on competitive factors and regulatory pressure.
Time usually reveals poor lending and the long-term performance of home loan portfolios for major banks suggest they have been prudent (considering the rate of home repossessions and overall losses).
The Reserve Bank of Australia estimates that annual losses faced by LMIs (which insure the riskier mortgages) averaged 3 basis points (that is 0.03%) between 1984 and 2012. And APRA and the RBA regard lending quality as largely satisfactory, although they remain cautious (as regulators tend to be).
The Royal Commission has shone a light on some weakness in lending standards, albeit based on regulatory reviews from a few years ago. This includes deficiencies in applicants’ income and expense verification. However, this doesn’t lead to weak lending standards overall. Loans are made on a case-by-case basis and what may appear to be lax, may involve little risk considering factors such as the amount of collateral.
One area where regulators are pushing for improvement is in the calculation of household expenses, which can be trickier to verify than incomes. Banks tend to use a benchmark – the Household Expense Measure (HEM) – which has been shown to be underestimating living expenses.
Banks don’t solely rely on this measure and do adjust the HEM. Also, HEM estimations are not woefully off the mark, considering that many households can cut costs if needed. But its extensive use suggests that some borrowers have larger loans than they probably should.
It’s a risk and the major banks have announced changes to their expense estimations. That’s likely to lead to lower lending levels for some borrowers and may coincide with greater operating costs to process home loans.
Keeping watch
Home loans aren’t the banks' only exposure to a heated property market. They also fund property developments – which are much riskier than residential mortgage loans (and one contributor to the spikes in Chart 6). Such lending remains a small portion of the major banks’ total loans and they have no apparent plans to increase exposure; foreign banks have been keener to lend.
Banks can also fund non-bank lenders that provide home loans. The risk with non-bank lenders is that they are not regulated and can provide the types of loans that banks don’t. Regulators are acutely aware of the risk of watching the front door while leaving the back unguarded. Banks do not provide a clear breakdown of such exposure, but non-bank lenders only account for around 4% of the home loan market.
Remember the returns
The numerous ways that banks could be adversely affected by wobbles in the property market reveal the difficulties in assessing their risk. But for investors, the risks need to be weighed against potential returns.
In this respect, there are two elements to our recommendations on the banking sector: a limit on total portfolio exposure (of 20% and closer to 10% for conservative investors); and, not overpaying for their shares.
In assessing a fair price, we consider the trade-off between risk and return, including the emergence of newer risks. In recent weeks regulatory risk has been most on the minds of investors due to the Royal Commission, but technological disruption may be of greater long-term significance and that will be the focus of the next article in this series.

