
CBA: Interim result 2017


Recommendation


- {{x.value}}
{{ twilioFailed ? 'SMS Code Failed to Send…' : 'Enter verification code' }}

{{ completedStep1 ? 'Authentication & Security' : content.trialHeading.replace('{0}', user.FirstName) }}

{{ content.upgradeHeading.replace('{0}', user.FirstName) }}
The email address you entered is registered with InvestSMART
Please login to continue
We have sent you an email with the details of your registration.
Looks you are already a member. Please enter your password to proceed
{{ upgradeCTAText }}
Updating information
Please wait ...
Your membership to InvestSMART Group recently failed to renew.
Please make sure your payment details are up to date to continue your membership.
Having trouble renewing?
Please contact Member Services on support@investsmart.com.au or 1300 880 160
You've recently updated your payment details.
It may take a few minutes to update your subscription details, during this time you will not be able to view locked content.
If you are still having trouble viewing content after 10 minutes, try logging out of your account and logging back in.
Still having trouble viewing content?
Please contact Member Services on support@investsmart.com.au or 1300 880 160
Please click on the ACTIVATE button to activate your Intelligent Investor 15-day free trial
Please click on the ACTIVATE button to finalise your membership
Unsuccessful registration
Registration for this event is available only to Eureka Report members. View our membership page for more information.
Registration for this event is available only to Intelligent Investor members. View our membership page for more information.
- You are already registered for this event.
- This event is already full.
- Please select a quantity for at least one ticket.
- {{ i }}
Forgotten password
Please enter your email address below to request a new password
- Indepth analysis of ASX listed shares
- BUY, Hold and Sell Recommendations
- Ideas Lab
- Special Reports
- Alan Kohler’s Weekend Briefing
- Interviews with CEO’s & top influencers
- Money Cafe and Talking Finance
- Super Advice and Q&A with Ask Alan

In light of the continuing tough conditions facing the big four banks, Commonwealth Bank's interim result was about as good as one could expect.
On the plus side, like its competitors, CBA ‘repriced' (ie hiked) rates on home loans but part of the benefit from this move was offset by increased competition in both home and business lending. However, the real culprit was on the liability side of the balance sheet, where competition for deposits and increased costs of wholesale funding more than offset the gains on the asset side.
Key Points
-
Cost growth contained
-
Provisions still at cyclical lows
-
Dividend up a smidgeon
Deposits remain at 66% of CBA's total funding and part of the recent scramble for deposits among the big banks was driven by new regulations which require them to hold more stable deposits (such as term deposits) to reduce the chances of a liquidity crunch.
All in all, CBA's net interest margin fell slightly, from 2.15% to 2.11%.
Due to recent political events overseas, the increased volatility in markets helped the bank's trading arm, which generated a 21% increase in income, to $600m. Along with better results from CBA's credit card business and increased merchant fee income, this helped offset falls in its insurance and funds management businesses.
Cost out, squared
With credit growth expected to be low and competition cranking up in Australasia – especially now that NAB and ANZ are concentrating more on their home turf – costs are even more of a focus than usual. Chief executive Ian Narev's goal is to keep cost growth to 1% a year on average, although he acknowledges this will be difficult to achieve.
However, his bank was successful in doing so in the first half of 2017, with operating expenses indeed only rising 1%, from $5,210m to $5,284m.
So despite fairly mundane income growth of 3%, this meant CBA's cost-to-income ratio fell to 41.5%, making it one of the world's most efficient banks.
| Six months to 31 Dec ($m) | 2016 | 2015 | /(–) (%) |
|---|---|---|---|
| Net interest income | 8,743 | 8,427 | 4 |
| Non-interest income | 4,002* | 3,993 | 1 |
| Total income | 12,745* | 12,420 | 3 |
| Operating expenses | (5,284)** | (5,210) | 1 |
| Profit before impairments | 7,445 | 7,152 | 4 |
| Impairments | (599) | (564) | 6 |
| Profit before tax | 6,862 | 6,646 | 3 |
| Cash earnings | 4,904 | 4,808 | 2 |
| Cash EPS ($) | 2.86 | 2.86 | - |
| Interim dividend |
$1.99 (up $0.01), fully franked, |
||
|
* Excludes $397m gain on sale of Visa stake ** Excludes $393m software amortisation write-off |
|||
What cost growth there was, was in part due to rising wages (as a result of a new Enterprising Bargain Agreement kicking in) but more to increases in software amortisation, which comprised 58% of the increase.
Software writedown
And that's without including the $275m writedown (or around $393m before tax) of capitalised software (see CBA writes down software, sells Visa stake on 19 Dec 16 (Hold — $81.20)) that the bank took on 31 December 16.
That is, the $220m in software amortisation in the first half included amortisation relating to the 17 projects subsequently written off at 31 December 16. Chief financial officer David Craig revealed that these projects would have continued to have been amortised over the next three years, so the writedown will save CBA around $131m a year in amortisation costs. To put this in perspective, CBA's software amortisation in 2016 was $379m.
When your goal is to keep expense growth to 1% per year, having an extra $131m buffer up your sleeve certainly helps. With the $393m effectively taken out of the cost line, we'll have to wait and see whether CBA claims ‘positive jaws' (income rising faster than operating costs) in future periods as Westpac did this year after similarly writing off some of its capitalised software (see Westpac: Result 2016).
While $393m might seem like real money, the bank continues to invest heavily in software and still has around $2bn in capitalised software on its balance sheet. Much of the additional expense is on digital platforms which tend to be amortised more quickly. So, with the pace of technological change quickening, it will be interesting to see whether further writedowns occur and how the bank treats them (see ANZ, Asia and accounting shenanigans for more).
Provisions
While on the subject of writedowns, it was good to see the increases in home loan arrears noted in CBA: Result 2016 have, for the most part, flattened out. As a result, impairment expense is still ‘bumping along the bottom' (see Chart 1).
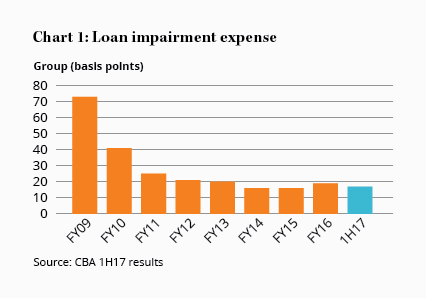
As such, total provisions as a percentage of credit risk weighted assets fell to 1.02%, less than half the 2.09% they reached in 2011. As we've noted in relation to all the big banks in recent times, we'd expect provisions to average out at higher levels over the course of the cycle.
Along with slower credit growth and perhaps further additional capital requirements being imposed by APRA, growth in earnings and dividends will be harder to come by.
For its part, though, as shown by its 16% ROE, CBA remains best placed among the big four and so was able to raise its dividend slightly. At 70% of first-half earnings, this gives it good wiggle room to maintain its full-year payout at between 70-80% of earnings.
As long-term members will know, we've had concerns about the Australian housing market for some time, yet have been proved wrong. However, with the various tailwinds that have supported Australian housing prices moderating or even reversing (see APRA takes a sickie), this is something we'll continue to monitor. HOLD.
*Please note our recommended maximum portfolio weightings of 10% for CBA individually and 20% for the banking sector as a whole. More conservative investors and those with other exposure to the property market should use lower limits.
Note: The Intelligent Investor Equity Income Portfolio owns shares in Commonwealth Bank and Westpac. You can find out about investing directly in Intelligent Investor and InvestSMART portfolios by clicking here.
Recommendation