
ANZ: Interim result 2015


Recommendation


- {{x.value}}
{{ twilioFailed ? 'SMS Code Failed to Send…' : 'Enter verification code' }}

{{ completedStep1 ? 'Authentication & Security' : content.trialHeading.replace('{0}', user.FirstName) }}

{{ content.upgradeHeading.replace('{0}', user.FirstName) }}
The email address you entered is registered with InvestSMART
Please login to continue
We have sent you an email with the details of your registration.
Looks you are already a member. Please enter your password to proceed
{{ upgradeCTAText }}
Updating information
Please wait ...
Your membership to InvestSMART Group recently failed to renew.
Please make sure your payment details are up to date to continue your membership.
Having trouble renewing?
Please contact Member Services on support@investsmart.com.au or 1300 880 160
You've recently updated your payment details.
It may take a few minutes to update your subscription details, during this time you will not be able to view locked content.
If you are still having trouble viewing content after 10 minutes, try logging out of your account and logging back in.
Still having trouble viewing content?
Please contact Member Services on support@investsmart.com.au or 1300 880 160
Please click on the ACTIVATE button to activate your Intelligent Investor 15-day free trial
Please click on the ACTIVATE button to finalise your membership
Unsuccessful registration
Registration for this event is available only to Eureka Report members. View our membership page for more information.
Registration for this event is available only to Intelligent Investor members. View our membership page for more information.
- You are already registered for this event.
- This event is already full.
- Please select a quantity for at least one ticket.
- {{ i }}
Forgotten password
Please enter your email address below to request a new password
- Indepth analysis of ASX listed shares
- BUY, Hold and Sell Recommendations
- Ideas Lab
- Special Reports
- Alan Kohler’s Weekend Briefing
- Interviews with CEO’s & top influencers
- Money Cafe and Talking Finance
- Super Advice and Q&A with Ask Alan

The headline numbers from ANZ's interim result were much healthier than Westpac's. While Westpac is prepared to sacrifice some market share to maintain the quality of its massive mortgage portfolio, ANZ is lending larger amounts to increase market share.
ANZ's Australian retail division increased profit by 8% compared to the same period last year and 2% compared to the prior six-month period. That's well above the corresponding figures of 0% and -2% for Westpac (see Table 2).
Homeloan flows for ANZ increased 8% (see Chart 1), virtually double that for Westpac. Though Commonwealth Bank and Westpac will likely need to raise more capital than ANZ and National Australia Bank to satisfy new regulatory capital rules as they have larger mortgage books, ANZ's average loan size at origination is currently over 20% larger than Westpac's at $376k.
Key Points
Healthier result than Westpac's
Suffering from similar issues
ANZ assuming more mortgage risk
It's not surprising then that ANZ is gaining market share in New South Wales and Victoria, where growth has been the strongest and property prices are the highest. Investors in particular are prepared to borrow heavily to get on the property ladder while interest rates are low. Remarkably, 35% of ANZ's loans are interest-only, which is why we don't see the RBA increasing interest rates much over the next decade despite many homeowners and investors being ahead on their loan repayments.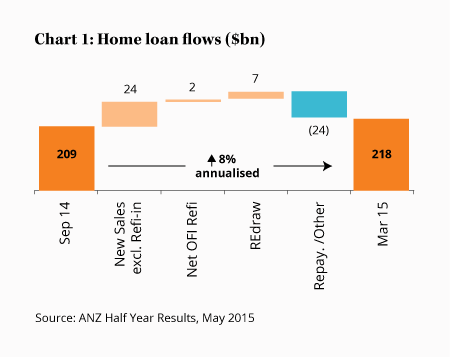
ANZ's net interest margin – the spread the bank keeps between the rates it offers on loans and pays on deposits and borrowings – has fallen from 2.09% (adjusted for currency movements) to 2.04%. Only two basis points relates to cutting loan rates, with the markets and treasury divisions responsible for three basis points. Just like Westpac, ANZ is finding it difficult to park and move money profitably while interest rates are so low.
| Six months to 31 Mar 15 | Six months to 31 Mar 14 | /- (%) | |
|---|---|---|---|
| Revenue ($bn) | 10.2 | 9.7 | 5 |
| Cash Earnings ($bn) | 3.7 | 3.5 | 6 |
| Cash EPS ($) | 1.34 | 1.28 | 5 |
| Return on equity (%) | 14.7 | 15.5 | -5 |
| Dividend ($) | 0.86 | 0.83 | 4 |
| Interim dividend | 86 cents fully franked, ex date 8 May | ||
In contrast to its Australian franchise, ANZ's Asian business is focused on clipping the ticket on low-risk transactional flows. What it does lend is mostly to institutions (see Chart 2), which we expect is only for short periods.
That's why ANZ hasn't recently suffered billions in losses like Asian-focused rival Standard Chartered. Standard Chartered sailed through the GFC as China unleashed the world's largest stimulus package, but recently loans have soured as China's growth has slowed and commodity prices have fallen. ANZ's bad debts increased recently suggesting they have bottomed after falling since the GFC, but they remain very low.
Management doesn't split out return on equity for Asia as it's well below what it achieves in Australia. That's not a major issue, but we're keeping an eye on Asian lending as corporations often borrow large amounts and a downturn in Asia is likely to run parallel with one in Australia, offering little protection.
Staying the course
Despite ANZ suffering from many of the same trends as Westpac, including minimal business lending growth, low interest rates, stricter regulatory capital rules on the way, return on equity falling from 15.5% to 14.7% and macroeconomic headwinds hitting ANZ's institutional banking division, chief executive Mike Smith hasn't walked away from his target of increasing return on equity to 16% by the end of 2016.
| Division | Six months to 31 Mar 15 ($m) | Change from prior six months (%) |
|---|---|---|
| Australia | 1,602 | 2 |
| Int'l & Institutional Banking | 1,459 | 9 |
| New Zealand | 566 | 7 |
| Global Wealth | 259 | -16 |
| GTSO & Group | -210 | 50 |
| Total | 3,676 | 2 |
If Smith is successful, earnings and dividends should increase and it could coincide with the announcement of his departure following a pretty successful tenure (albeit one for which he has been paid accordingly).
In contrast to Westpac, which is underwriting its dividend to help raise $2bn to meet impending capital requirements, Smith will consider selling businesses to raise capital if necessary. ANZ's dividend reinvestment plan is operating with a 1.5% discount in the interim.
ANZ's share price is essentially where it was 18 months ago and our preferences among the big four remain Commonwealth Bank and Westpac as they continue to benefit from their dominance of the Aussie market. But if you're comfortable with the extra risk of owning ANZ then sit back and enjoy the dividends, and hope the architect of ANZ's super-regional strategy Mike Smith hangs around for a while yet. SELL.
Note 1: Our maximum recommended portfolio limit for the banking sector is 20%, although conservative investors might consider a limit of less than 10% at current valuations, particularly if you have other large exposures to residential property.
Recommendation