Weekend Economist: Where prudence lives
The Reserve Bank of Australia released its Financial Stability Review (FSR) this week amid considerable angst around the potential impact of rising investor credit on the Australian economy.
Comments from RBA Governor Glenn Stevens indicate that APRA Australian Prudential Regulation Authority (the regulator responsible for implementing policy around financial stability) is considering further policy initiatives aimed at slowing the growth in investor credit.
However, it is not clear whether any specific new policies will be adopted. Discussions on this issue over a number of years indicate that the Reserve Bank sees the application of interest rate buffers (an interest rate add on to the mortgage rate) to the approval process and serviceability measures as the most favoured approaches. The FSR notes that APRA is already strengthening its oversight of bank risk management frameworks around this issue. To date, however, no new explicit guidelines have been announced by APRA and the Reserve Bank.
Curiously the dynamic which the RBA seems to fear the most is that “speculative demand can amplify the property cycle and increase the potential for prices to fall later, with associated effects on household wealth and spending”. The irony around this argument is that the bank seems to be concerned about a build- up in the construction of new properties which may lead to over- supply and subsequent price falls. Of course the lift in residential construction has, until recently, been seen as a key part of the rebalancing of the economy away from mining investment.
Investors are key to this process since large residential projects will not attract sufficient pre sales to satisfy financiers without offshore and domestic investor support.
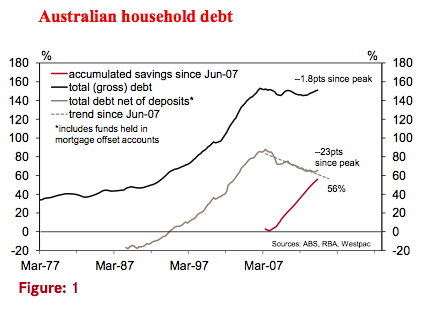
Another key concern has been that because the household debt to disposable income ratio remains near record highs any further increases represent a risk for the economy.
Australian households’ balance sheets tell a much more intriguing story than this simple gross stock/flow ratio.
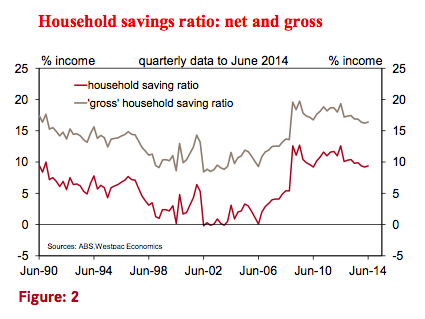
For a start it seems somewhat curious that the household savings ratio lifted from around 4 per cent in the years immediately prior to the GFC to 10 per cent post GFC and yet the common view of the Australian household sector has been that leverage has remained at record highs.
Where have all these new savings gone?
The next graph shows two household savings rates. The difference is the treatment of depreciation of the family home. In calculating the standard savings rate the ABS includes depreciation of the family home as a form of spending. We do not believe that this depreciation factor should be treated as an expenditure item. As such the current adjusted savings rate of the Australian household sector is around 16.4 per cent compared to the standard ABS measure of 9.4 per cent.
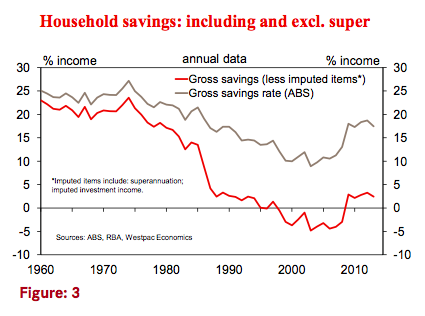
It is important to note that in the “income” measure the ABS appropriately includes compulsory contributions made on behalf of employees by firms to superannuation as well as investment income from superannuation. Both these components of income contribute directly to savings. The next graph shows the preferred savings rate (albeit on an annual basis) and the savings rate if contributions and income from superannuation are excluded from savings.
There are some important points to note:
Including savings from superannuation the current savings rate increases from 8.9 per cent to 17.5 per cent (at June 2013, the latest available data from annual series).
Excluding superannuation the savings rate was negative between 1995 and 2009. That was a time when household leverage lifted sharply. Essentially, Australian households were relying upon rising equity in their houses to finance spending.
Throughout that whole period the total gross savings rate has remained strongly positive due to the lift in savings in superannuation. It is arguable that Australians relied on the “comfort” from rising super balances to justify the lift in leverage.
Since 2008 Australians have been accumulating savings in addition to superannuation.
The question is: where have Australians been accumulating savings over and above mandatory contributions to super and associated investment returns?
Firstly, Australians have been accumulating superannuation at a faster pace than income growth (well in excess of the mandatory contributions required). In 2007 the ratio of superannuation assets to disposable income stood at 1.78; that ratio is now 2.04. That increase is explained by contributions growing faster than incomes and, recently, investment returns exceeding income growth.
Secondly, Australians have been accumulating bank deposits. Balances in mortgage offset accounts and redraw facilities have risen to be around 15 per cent of outstanding loan balances, as reported by the RBA. This is equivalent to two years of scheduled repayments at current interest rates.
Overall, financial assets (deposits and cash) as a proportion of disposable income have lifted from 64.2 per cent to 85.8 per cent between 2007 and 2014. That means that net debt (excluding superannuation and housing assets) has fallen from 88.0 per cent of disposable income in 2007 to 65.0 per cent in 2014 - back to 2003 levels. Based on the RBA estimate above, clearly a large proportion has been due to increases in offset and redraw facilities.
Encouragingly, the ex super gross savings rate does provide scope for a lift in the pace of consumption growth despite ongoing weakness in wages growth.
Note that it has lifted from – 4.8 per cent to 2.4 per cent and held there since the GFC. We estimate that a fall in that savings rate from 2.4 per cent to 1.4 per cent over the course of the next 12 months or so could boost underlying consumer spending growth from its current 2.0 per cent annual pace to 2.7 per cent.
The balance sheet of the Australian household sector has strengthened markedly.
It is in far better shape than implied by a gross debt to disposable income ratio.
Firstly, the household sector has been accumulating superannuation assets at a rapid pace. Contributions to superannuation have engineered a high savings rate.
Secondly, the sector has lifted its ex super savings rate from – 4.8 per cent pre GFC to a steady 2.4 per cent over the last 5 or so years. These savings have been allocated to discretionary superannuation contributions and the accumulation of financial assets (deposits and cash), particularly through bank offset and redraw facilities. This has reduced the ratio of NET household debt to disposable income from 88.0 per cent to 65.0 per cent (back at 2003 levels).
Finally, despite a cautious business sector which is successfully restraining wages growth this high savings rate represents an opportunity for households to lift consumer spending growth without returning to the debt fuelled spending practices before the GFC.
The strength of the household sector’s balance sheet will provide the Australian economy with a solid foundation for a lift in growth momentum in 2015.
Bill Evans is chief economist with Westpac.


