Solar's Queensland collapse
Across the nation, many solar businesses are feeling the pinch. Not for the first time, business models are being readjusted. The end of feed-in tariff supported installations in Queensland means that the Australian solar industry has been wound back by 25-33 per cent overnight.
Once the South Australian feed-in tariff is wound back, Australia will enter a new phase – one of overall stability but flat profitability.
Businesses that succeed in this new market will be those that optimise their sales and marketing expenditure through targeted marketing and commercial sales.
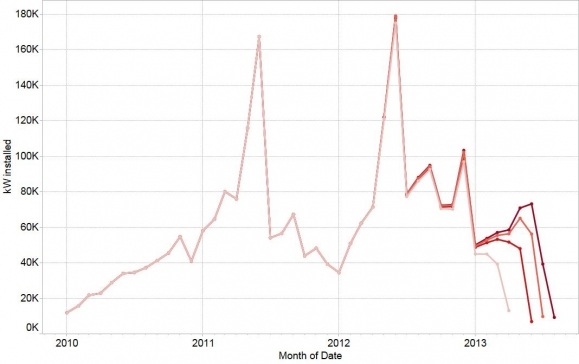
Australian solar PV capacity installations per month (kilowatts)

Previously, solar businesses had to face overnight halts to installations as feed-in tariffs closed, then figure out how to cover overheads as the cost of systems plummeted.
But the latest release of installation data from the Clean Energy Regulator reveals the impact of the closure of the Queensland 44c/kWh feed-in tariff. The graph above shows the monthly installation tally according to CER data releases in recent successive months, with the most recent releases shown in darker colour. When interpreting the graph, it's important to correctly interpret the apparent turn down in the most recent two months since any data release, as systems can take 12 months from installation to appear in the dataset. For example, June's installation figures appeared to be 7 MW when June's data was released, which jumped to 57 MW when July's data was tallied, and then to 73 MW when August's data was tallied.
However, the most recent data set is different. It shows the second-last data point to be a 45 per cent reduction on the third-last data point. This implies a distinct plunge in installations occurred in July.
Even though the actual plunge is likely to be less than a 45 per cent reduction, such plunges previously only occurred when nationally-simultaneous incentive wind-backs (i.e. multiplier reductions) occurred – in which case installation volumes truly fell by 67 per cent.
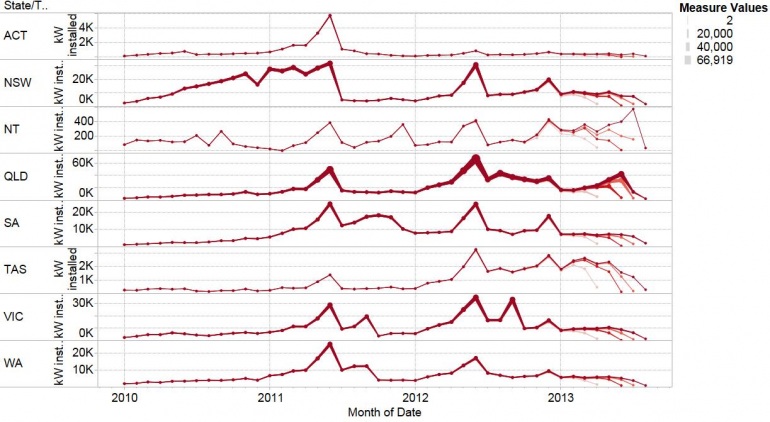
The reason for this recent downturn is the loss of the Queensland market, (which represented 50 per cent of the market nation-wide, and 67 per cent of the market in June). The graph below shows the national data broken out by state.
Note that the axes are independent for each state, but the thickness of the line (also showing capacity installed) is consistent across each state. We can see that there was a massive turndown in June in Queensland, but there has also been a consistent slide in Tasmania since June. In spite of the downturn in Queensland, the data in Western Australia, Victoria, South Australia, NSW, and the ACT shows remarkable month-on-month consistency.

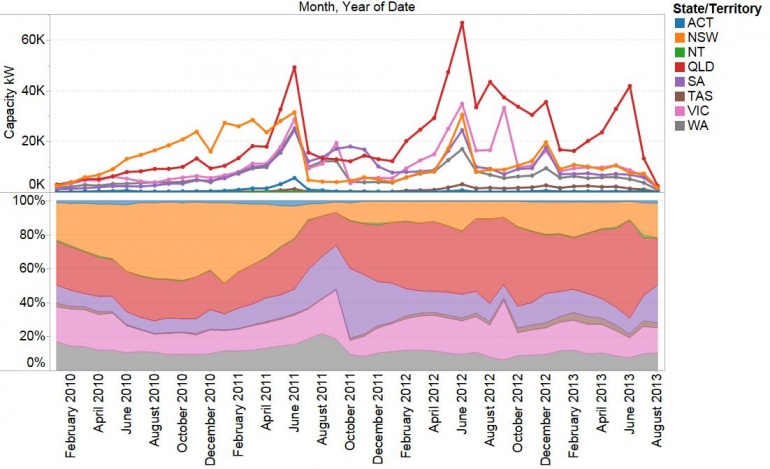
The lower sheet shows information from the most recent CER data release. It identifies the overall market stability over the first half of the year; the exception being the Queensland market.
Interestingly, it is SA that has gained market share in the second half of 2013, which is the likely result of the closure of its feed-in tariff.
However, SA hasn't responded to its feed-in tariff closure to the extent that it responded to a previous wind-back in September 2011, and certainly it is not enough to offset the loss of the Queensland market. Meanwhile NSW is regaining some market share – NSW being the state that best figured out how to sell solar without a feed-in tariff

Once South Australia's feed-in tariff is wound back, the solar industry will face a new phase of the solar industry evolution, that of general market stability but flat profitability for the average business.
Warwick Johnston is managing director of Sunwiz Consulting. Sunwiz will be at the All Energy Conference to be held in Melbourne next week where Warwick will provide details and demonstrations of SunWiz’ services and software such as PVsell and Solar Hot Spots that are helping solar businesses better target their sales efforts.
This article was originally produced by Sunwiz. Republished with permission.


