
Share investing, marriages, and knowing when to split


- {{x.value}}
{{ twilioFailed ? 'SMS Code Failed to Send…' : 'Enter verification code' }}

{{ completedStep1 ? 'Authentication & Security' : content.trialHeading.replace('{0}', user.FirstName) }}

{{ content.upgradeHeading.replace('{0}', user.FirstName) }}
The email address you entered is registered with InvestSMART
Please login to continue
We have sent you an email with the details of your registration.
Looks you are already a member. Please enter your password to proceed
{{ upgradeCTAText }}
Updating information
Please wait ...
Your membership to InvestSMART Group recently failed to renew.
Please make sure your payment details are up to date to continue your membership.
Having trouble renewing?
Please contact Member Services on support@investsmart.com.au or 1300 880 160
You've recently updated your payment details.
It may take a few minutes to update your subscription details, during this time you will not be able to view locked content.
If you are still having trouble viewing content after 10 minutes, try logging out of your account and logging back in.
Still having trouble viewing content?
Please contact Member Services on support@investsmart.com.au or 1300 880 160
Please click on the ACTIVATE button to activate your Intelligent Investor 15-day free trial
Please click on the ACTIVATE button to finalise your membership
Unsuccessful registration
Registration for this event is available only to Eureka Report members. View our membership page for more information.
Registration for this event is available only to Intelligent Investor members. View our membership page for more information.
- You are already registered for this event.
- This event is already full.
- Please select a quantity for at least one ticket.
- {{ i }}
Forgotten password
Please enter your email address below to request a new password
- Indepth analysis of ASX listed shares
- BUY, Hold and Sell Recommendations
- Ideas Lab
- Special Reports
- Alan Kohler’s Weekend Briefing
- Interviews with CEO’s & top influencers
- Money Cafe and Talking Finance
- Super Advice and Q&A with Ask Alan

John Addis
Share investing, marriages and knowing when to split
It was my wedding anniversary on Wednesday, and what better way to spend it than investigating where I went wrong last time. Amongst other factors, a story in The Atlantic titled The Divorce-Proof Marriage proposes a positive correlation between marriage length and the number of wedding guests (see below).
Eloping American couples are 12.5 times more likely to end up divorced than couples that get married at a wedding with 200 or more people. For me, there were only seven last time around, including the photographer and celebrant, so it's surprising the thing lasted the week. Second time around, The Architect and I had about 15 guests, but I wasn't aware of this chart three years ago.
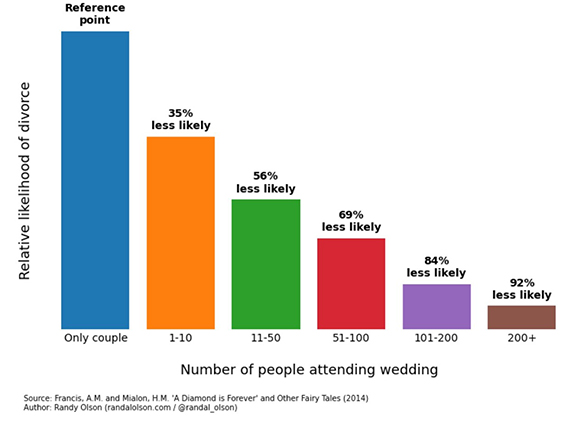
The theory is that the more people that witness your marriage, the greater the power of the commitment effect. Accepting that correlation is not causation of course, but much the same thing goes for an investment publication like this. It's easy admitting a mistake to oneself compared to putting it down in print before tens of thousands of readers. But that's what senior analyst James Greenhalgh did with iSentia this week.
It was only a month ago that James added the stock to our Buy List. The media monitoring service had issued a profit warning, the share price had collapsed and yet the company's market position looked “impregnable”, or so he thought. But after further research – good analysts are always doing further research – James filed for divorce. It was an unprecedentedly rapid separation.
In this business, if you get six or seven picks out of 10 right, you're ahead of the game. James' stock picking record might be a little better than that because of an ability to not just pick cheap stocks but to change his mind and publicly admit mistakes. Maybe I should have married him.
To the list of psychological biases that undermine investment returns, you can also add myopic loss aversion (focusing too much on the short term at the expense of long-term gains), anchoring (fixing on an arbitrary things like a buy price and not adapting to changing circumstances) and herding (doing what everyone else does, like getting married).
There are so many biases they're a herd unto themselves, each doing its bit to tug us away from rational, independent, profitable decision making. It's a tricky business, which explains why the average investor sucks at investing.
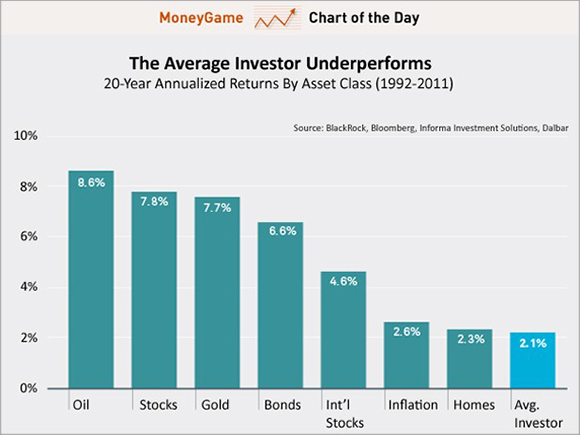
Sources: BlackRock; Bloomberg; Informa Investment Solutions; Dalbar.
The latest data from 1996 to 2016 supports the claim. Whilst the average annualised return of the S&P500 was 8.19 per cent, the average mutual (“managed” in an Australian sense) fund investor returned just 2.11 per cent, again less than inflation. Doh.
So, how does the average investor get 75 per cent less than the index return? Well, they're buying the same stocks as you and I, but instead of buying them low and selling them high they're doing the opposite. It is their emotions that fail them, not their analysis. Another Blackrock chart spells it out with a shrink-like language we can all relate to.
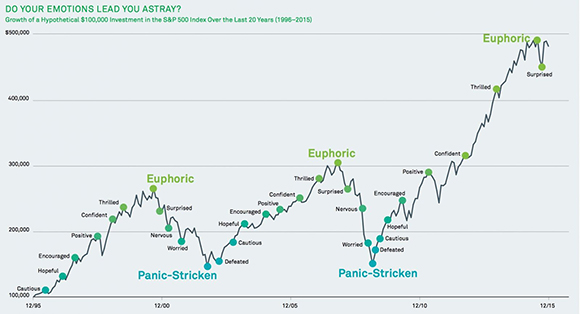
The point of capitulation – the blood-in-the-streets-moment, as Buffett would say – is in aquamarine blue, when most investors are selling. That's the point when the smart money is being put to work. The euphoric optimism at the top, when prices stretch far beyond value, is in green. This is when the smart money gains from the previous capitulation are locked in.
Of course, no one gets the timing exactly right but if price and value is your guide rather than fuzzy psychological concepts like herd euphoria and panic, by selling out to the patsies at the top and buying from them at the bottom you'll do well enough.
So, where are we on the chart? No one knows, of course. It's easy knowing what will happen two years hence when your starting point is five years in the past. But, as I rarely knock back a future opportunity to look foolish, let's take a stab anyway.
In residential apartments I'd guess many investors have recently tipped over from euphoria to either nervous or worried. In bonds, since the sell-off late last year, the Trump-driven comeback suggests optimism about a return to normality in terms of interest rates, economic growth and inflation. The yield on US 10-year treasuries hit 2.39 per cent this week and the Bloomberg Barclays Global Aggregate Index, a measure of investment grade debt from 24 countries, yesterday enjoyed its third consecutive monthly gain. Hopeful then, maybe.
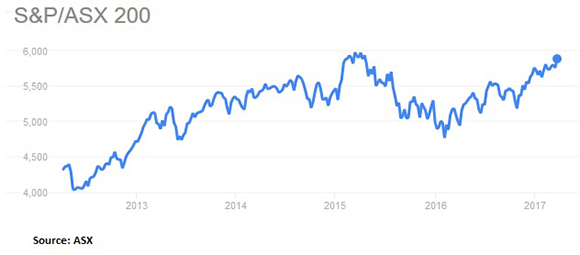
As for stocks, despite the S&P/ASX200 near a two-year high and a generally good reporting season, investors seem encouraged but hardly euphoric. We're still finding the occasional opportunity, but are not spoilt for choice. All up, those emotional extremes that characterise the high and lows are hard to find, except perhaps at the occasional inner-city auction. Incidentally, S&P reported this week that more borrowers are falling behind on their mortgage repayments.
Nevertheless, these charts make a salient point. As famed investor Seth Klarman once said, “Investing is the intersection of economics and psychology”. Getting the economics right in my view is the easy bit. It's the kind of decisions that James faced with iSentia this week where so many of us go wrong, professionals included.
Actively managed funds – those that try and beat their benchmark index – are having a terrible time of it. Active managers face all the problems average investors do, plus the additional headaches of short-term performance measurement and a big money problem, which restricts the range of stocks they can own. The typical result is index-like performance if you're lucky, minus the fees.
According to S&P's SPIVA 2016 mid-year report, over the most recent 10-year investment horizon, 85 per cent of large-cap managers, 91 per cent of mid-cap managers and 91 per cent of small-cap managers failed to outperform on a relative basis. Interestingly, while only 1-in-10 active managers beat their benchmark, the same figure for value managers was 1-in-3; better but still not great.
Australia lacks results over a similar timeframe but the shorter timeframes are equally damning. I'm unaware of any other industry than can do such an appalling job for its customers and still be so ludicrously overpaid for it, especially here, where fees tend to be higher than the US.
What is an average investor to do? If active funds generally don't beat the index and managing your own money is too taxing or time consuming, the first option is to settle for index returns at a much lower fee and get on with life. Many investors appear to be doing just that, as this FT chart of US data, indicates.
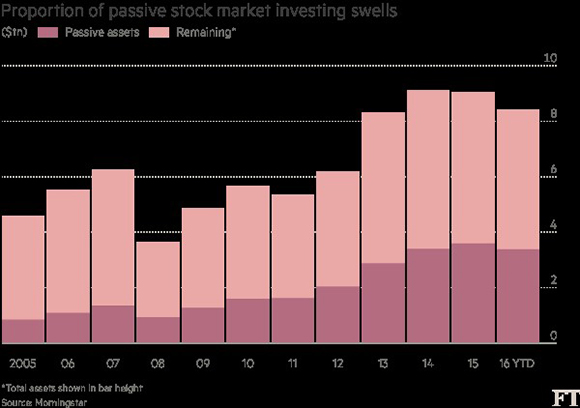
A decade ago, passive US assets (index trackers and the like) accounted for about 20 per cent of total sharemarket assets. They're now twice that, fuelled not just by the rise of passive funds but also the booming market in exchange traded funds (ETFs).
The second option, which, unlike most passive funds, acknowledges the over-exposure most Australian investors have to property, the big banks and our own economy, is to build a portfolio of low cost ETFs which correct for these factors. Or you can pay someone like us a modest fee to do it for you (see InvestSMART's ETF-based portfolios).
Those wanting to beat the market over the long term have two further options. The first is to use a service with a good long-term track record of doing so, like Intelligent Investor (that sound in the background is me pushing a barrow) and use it to help you run your own portfolio.
The second is to use a few carefully chosen active fund managers (diversification is sensible in funds as it is in stocks), ensuring that the fees are reasonable, the track record is good and that the fund isn't too large, which can handicap future returns. There are plenty of choices, including Intelligent Investor's SMAs based on our model portfolios. But as I said, choose carefully.
The final point is down to you. No matter what choice you make, if you panic at the wrong time, selling out when stocks are cheap and buying in when they're expensive (the fear of missing out), you're effectively choosing to be one of those investors that fail to beat inflation. Like marriage, success in investing is a game played largely in the head.
Have a good weekend and, in the words of Clive Dunn in Dad's Army's, don't panic (please check out the video, it's oddly hilarious even now).
Last Week
Shane Oliver, AMP Capital
Investment markets and key developments over the past week
- Stronger global economic data dominated the action over the last week, reversing some of the fears around whether President Trump will be able to pass his pro-business policies through Congress. So while Japanese and Chinese shares slipped, US, Eurozone and Australian shares rose. While the $US reversed the previous week's decline commodity prices were mixed and the $A rose slightly.
- The UK has finally lodged its notification to the European Union to formally start up to two years of divorce proceedings. Ho hum! It's been talked about for so long that markets barely reacted. There will be a long way to go with lots of noise. The European Union will be a tough negotiator as membership of it brings benefits and obligations so there is a high risk of a hard Brexit. Just remember though that the UK is only 2.5 per cent of global GDP and there has been no evidence that the Brexit vote led to a domino effect of other countries looking to exit as well (in fact the three Eurozone elections since Brexit have seen less support for anti-Europe populists). So there is no need for investors to get excited about it.
- US Congress to remain an ongoing source of noise for investors, but what's new. While the failure of the Obamacare reforms has led to a quick shift to focussing on tax reform, negotiations amongst House Republicans around a passable health care bill appear to be continuing so it's not dead in the water. Talk of another government shutdown will also likely start to escalate through April as a new continuing resolution funding spending will need to be passed by April 28th. Ongoing dysfunction in Congress means that a shutdown is possible but as the 2013 experience showed it's not in either the Republican's or Democrat's interest to be seen as the cause. So our base case (70 per cent probability) is that a deal will be worked out when required. And then of course around July to September the debt ceiling will need to be raised again or further suspended which might bring us back to the old “will the US government default?” debate. Again our view is that this will be solved too but it could go down to the wire. All up this is really just more of the same but as long as Trump gets something through at least on tax cuts, share markets should be reasonably happy. Meanwhile, he is continuing to wind back business regulation with the latest being the lifting of a number of restrictions on energy companies and with the Administration signalling mostly modest changes to NAFTA in relation to Mexico, the Mexican Peso is up 15 per cent from its January low.
- APRA's long awaited additional macro prudential tightening adds to the likelihood that the Sydney and Melbourne property markets will start to slow. The main change from APRA was an expectation (or directive) that lenders limit interest only loans to 30 per cent of new mortgage lending (from around 40 per cent at present), strict limits on loan to value ratios above 80 per cent for interest only loans along with an expectation that lending to investors remains "comfortably below" the 10 per cent growth limit, that serviceability measures remain "appropriate" and that lending to high risk categories is “constrained”.
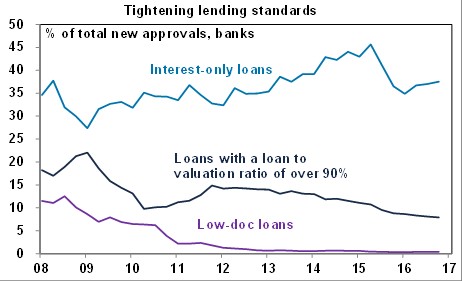
- That APRA moved again was no surprise (they should have done something last year!), but the main surprise was that the investor lending speed limit remains at 10 per cent rather than being cut to a more reasonable 5-7 per cent. Limiting interest only lending may have the same effect as cutting the speed limit because around 60 per cent or more of investor loans are interest only, but time will tell so further action may be required. Putting that uncertainty aside though, the latest moves by APRA, coming on the back of bank mortgage rate hikes over the last two weeks, the likelihood of action to boost affordability in the May budget (including a cut to the capital gains tax discount), the surge in unit supply at a time of silly prices are all likely to result in a slowdown in property price gains in Sydney and Melbourne this year ahead of a 5-10 per cent price fall starting next year some time. In the short term all eyes will be on Saturday's auction clearance rates to see whether there is much headline impact from APRA's moves!
- Our thoughts are with those affected by Cyclone Debbie along Australia's north east coast. While it's too early to know the full extent of the damage, economic disruption (to crops, tourism, mining activity, etc) could knock 0.1 to 0.2 per cent off GDP growth spread across the March and June quarters (but mainly the latter) and a boost to headline inflation via higher fruit and vegetable prices in the June quarter is likely as the area is a major supplier of bananas, tomatoes, etc. The RBA will tend to look through these affects though as it has in the past as they will be temporary.
Major global economic events and implications
- US data over the last week was strong with consumer confidence at is highest since 2000, home prices continuing to rise, pending home sales up more than expected, jobless claims remaining low, December quarter GDP growth being revised up and the goods trade deficit narrowing in February.
- Eurozone sentiment readings were strong with overall economic sentiment about as high as it ever gets and strong readings for the German IFO business conditions index. Against this, Eurozone bank lending data was weaker than expected in February with slower lending growth to corporates and stronger lending to households.
- Japanese data for February was mixed with strong industrial production and labour market data but household spending remaining weak and core inflation stuck around zero.
- China's business conditions PMIs rose in March indicating that growth has continued to edge up. Last year's stimulus has done the trick and its increasingly looking like the growth up tick is broadening out beyond the initial impact of the stimulus in particular into private sector services companies. It's consistent with policy makers continuing to tap the brakes.
Australian economic events and implications
- In Australia new home sales showed a continued gradual downtrend, job vacancies remained solid and private credit growth slowed further led by weak business lending. Of most interest in the credit data was a pickup in lending to property investors to 6.7 per cent year on year and over the three months to February it grew at annualised pace of 8.3 per cent compared to just 4.3 per cent a year ago. No wonder the regulators are looking to ensure it does not continue to accelerate.
Shane Oliver is head of investment strategy and chief economist at AMP Capital.
Next Week
Craig James, CommSec
Upcoming economic and financial market events
Quiet week ahead in Australia
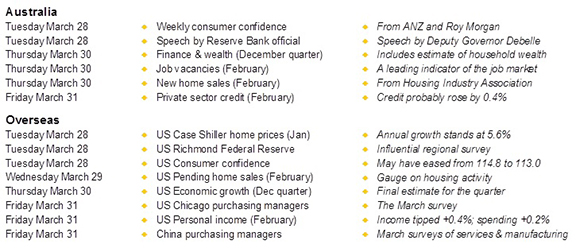
- As was the case in the past week, there are no ‘top shelf' indicators due for release in Australia in the coming week.
- The week kicks off on Tuesday when Roy Morgan and ANZ release the weekly consumer confidence reading. Aussies consumers have become a bit more downbeat of late with the latest confidence reading the lowest in eleven months. No doubt the discussion about risks in the housing market have spooked some. The question is whether the significant amount of home building underway at present gives way to localised oversupply, driving down home prices.
- Certainly home prices have lifted significantly in places like Sydney and Melbourne. And more homes (especially apartments) are being built. But interestingly the latest data suggests that existing home buyers aren't selling up, and that is another factor intensifying demand for the number of properties on the market.
- In the December quarter, property settlements in Sydney were the lowest for any December quarter in the past 11 years. And while Generation Y are getting their own places in other cities and states, in Sydney the number of people per household remains relatively stable and higher than other cities.
- On Tuesday there is speech from Reserve Bank Deputy Governor Guy Debelle to be delivered to the FX Week Australia conference. Investors will watch for any new warnings about the state of play in the housing industry.
- On Thursday, there are three items of note. First, the Bureau of Statistics releases the Finance & Wealth publication. Second, the ABS issues data on job vacancies. And third, the Housing Industry Association releases data on new home sales.
- The Finance & Wealth publication includes a raft of indicators such as the share of bonds or equities held by foreign investors; the average wealth level of Aussie families; and cash holdings by consumers, businesses and fund managers. The data should show that wealth is at record highs but it will interesting to see how much debt has risen in comparison.
- The job vacancies data is a key forward-looking gauge on the job market, like job advertisements. The difference being that vacancies data is only released quarterly while job ads is issued monthly. In broad terms, vacancies and ads are both at, or near, 5-year highs, pointing to positive prospects for employment.
- The home sales data is important in getting a sense of the supply component of the supply-demand equation. While home sales eased 2.2 per cent in January, the number of sales remains comfortably above both 5-year and 10-year averages.
- And on Friday the Reserve Bank releases the private sector credit data – effectively measuring the changes of outstanding lending. The data has proved a little volatile in the past few months, surging 0.7 per cent in December before inching 0.2 per cent higher in January. On average, credit has been growing around 0.4-0.5 per cent a month and similar growth is tipped for the February data.
Quiet times continue in US and China
- In the US there are healthy offerings of new economic data, but the indicators are more ‘second tier' rather than top shelf. But there will be at least 10 more speeches by Federal Reserve presidents and officials to digest. In China the purchasing manager surveys will be issued on Friday.
- The week kicks off on Monday in the US with the release of the Dallas Federal Reserve manufacturing business index.
- On Tuesday, there are a number of indicators to watch. Advance readings on international trade and inventories, both for February, are scheduled. The influential Richmond Federal Reserve survey is also released. And the usual weekly data on chain store sales is also issued.
- But of more interest on Tuesday will be the March consumer confidence results together with the Case Shiller survey of home prices for January. Consumer confidence lifted to 15-year highs In February so there may be some retracement in March. And home prices may have lifted 0.8 per cent in January after a 0.9 per cent gain in November.
- On Wednesday in the US, the pending home index is released alongside the usual weekly data on housing finance. And on Thursday in the US the usual weekly data on jobless claims is released alongside the final estimate of economic growth (GDP) for the December quarter. The US economy is growing near a 2 per cent annual pace.
- On Friday in the US, data on personal incomes and spending is issued with the Chicago purchasing managers' index. Economists think incomes rose 0.4 per cent with spending up 0.2 per cent. The spotlight will also shine on the Federal Reserve inflation measure – the core personal consumption deflator. Annual price growth is 1.7 per cent. Any easing in the inflation estimate and the Fed can take time in lifting rates, weighing on the greenback.
- Also on Friday in China the National Bureau of Statistics releases the “official” purchasing manager surveys covering the manufacturing and services sectors.
Financial markets
- Total returns on Australian shares – dividends and share prices – have been consistently hitting record highs since mid-February. The All Ordinaries Accumulation index may be up just 3 per cent over 2017 but it is up by a more meaningful 16 per cent over the past year. In fact annual growth of sharemarket returns has been holding above 15 per cent for most of 2017.
- In terms of share prices, the Aussie sharemarket has under-performed in 2017, lifting around 2 per cent and is in 51st spot of 73 bourses. The US Dow has lifted around 6 per cent and is in 26th spot. Hong Kong and India have lifted around 10 per cent in 2017 and near the top of the ranking list.
Craig James is chief economist at CommSec.
Readings & Viewings
Well, it's official. Britain has triggered Article 50 and is leaving Europe. That's where we start with Readings & Viewings this week, but there were a lot more happenings around the world this week.
So, the Brexit process has started, and some insurers and banks are already heading for the UK exits. They even include Lloyd's of London (founded in 1688) and Royal London.
So why would Lloyd's of London, of all companies, be wanting to move to Brussels?
And the Irish are getting excited about Brexit. They're already drawing up development plans.
With thousands of Irish living Australia, there could be an exodus. Those needing to renew their passports won't have any trouble.
Meanwhile, the Bank of England is on the back foot after it was found that animal fat is being used in Britain's £5 notes. Animal rights and religious groups are outraged.
Over in the US, Blackrock, the world's largest fund manager with $US5.1 trillion of assets, has taken a proactive stance on its active managers by slashing jobs.
Is Warren Buffett getting poorer? We don't think so, but he's not as rich as Amazon CEO Jeff Bezos – who's now the second-richest person on the planet.
Chinese messaging and gaming group Tencent has bought a 5 per cent stake in Tesla.
Uber's workplace diversity report has some interesting findings on who's behind the wheel.
Meanwhile, Uber is backing out of Denmark.
More and more consumers are using “tap and go” terminals for purchasing everyday items using their credit cards. But now London's Financial Conduct Authority is telling banks not to force customers into using the technology.
His healthcare bill overhaul plans in tatters, President Trump plans to sign a repeal of Obama-era broadband privacy rules.
Westinghouse is shifting its focus from building nuclear reactors to dismantling them.
Britain's new 12-sided £1 has just gone into circulation, but it won't work everywhere.
Household debt has been discussed a lot here lately, while in the US, they're talking about venture debt. A California venture debt firm claims it just came off its busiest quarter in 37 years of business.
Meanwhile, as American shopping malls become ghost towns, demand for mall spaces is outstripping availability in India. And retailers vying for a spot should take note of this to cut down costs.
A telling map on where income has grown the most in America over the past 25 years.
It's been five years since Facebook feasted on Instagram, and now it's hungry for some of Snap's market share. It's not buying it, just nibbling away at the edges. If only Facebook could read our minds about what we really want and need.
Want to bulletproof your day? Here's the morning routine of ‘professional biohacker' Dave Asprey, the guy who created bulletproof coffee.
An old story – or tale, depending which side you're on – that's circulating again: the Hermes Birkin bag is a better investment than gold. Its annual returns smashed the S&P average too.

