SA emissions down by third since 2005
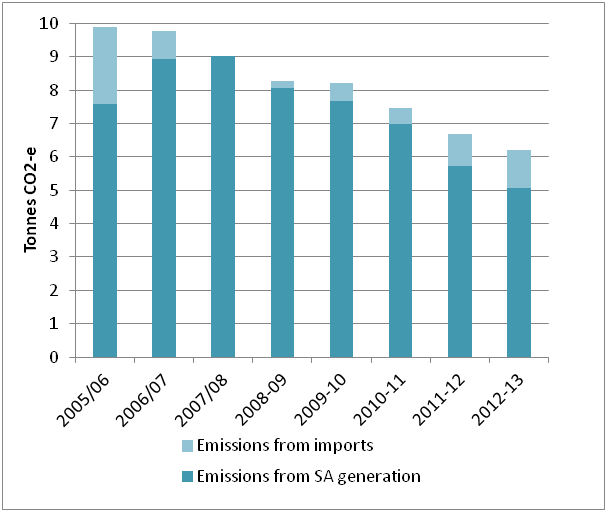
South Australia’s power sector greenhouse gas emissions have declined by over a third since 2005-06 according to Australian Energy Market Operator data.
AEMO has just released its 2013 update of historical data on South Australian power generation. It contains a wealth of information on each power generator’s output and how SA is managing a surge in generation from wind and now solar PV. The chart below illustrates what a significant impact the addition of this renewable generation has had on carbon emissions, in combination with more recent drops in electricity demand.
South Australia’s electricity sector greenhouse gas emissions

Note: Data sets for this chart are not uniform with 2005-06 to 2007-08 taken from AEMO (2011) SA Supply and Demand Outlook and subsequent years taken from AEMO (2013) South Australian Historical Market Information Report – 2013. This may involve some discrepancies in emissions calculations.
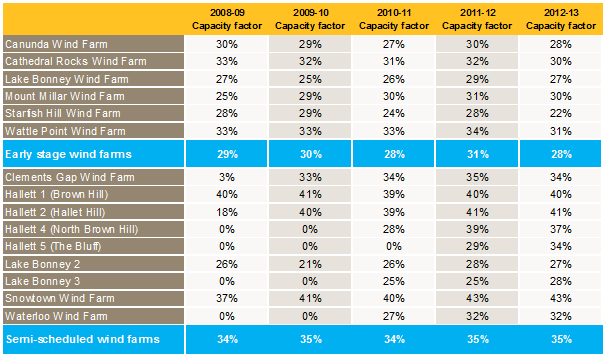
Another interesting aspect from the report is that more recently constructed wind farms (built after semi-scheduling was required) produce more power per unit of capacity installed (the ‘capacity factor’) than earlier wind farms. The common belief of economic models has been that capacity factors of wind farms would deteriorate over time as developers used up the windiest sites first and then had to resort to poorer wind sites.
The table below shows that the early wind farms built prior to semi-scheduling tend to average a capacity factor of about 30 per cent while the more recently constructed projects average about 35 per cent. It appears that technology has progressed faster than we’ve used up the wind resource.
Capacity factors of SA wind farms pre and post semi-scheduling

Note: Where wind farms were being constructed in a year and therefore only operational for part of the year they have been excluded from the calculation of average capacity factors across all semi-scheduled wind farms.
Source: AEMO (2013) South Australian Historical Market Information Report – 2013
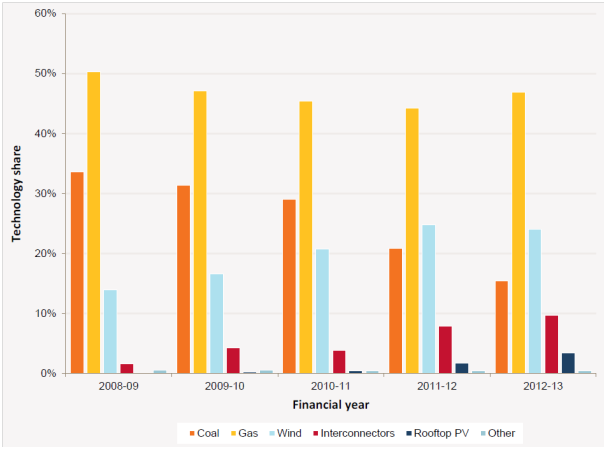
The report also provides more accurate information on the precise market shares of different sources of power relative to the Climate Spectator article, SA on verge of 30% renewables. AEMO's report outlines that wind represented 24.1 per cent of supply and rooftop solar PV approximately 3.4 per cent making a total of 27.5 per cent renewables. This is lower than estimated in the earlier Climate Spectator article, due partly to non-scheduled wind generation being lower this year than historical averages used in our estimates.
Nonetheless the conclusion is still the same – once Snowtown II wind farm is complete, SA will comfortably pass 30 per cent renewables in its power supply.
The state's estimates of market share by fuel type are illustrated below.
South Australian energy generation by fuel type

Source: AEMO (2013) South Australian Historical Market Information Report – 2013


