
Mind the income gap


- {{x.value}}
{{ twilioFailed ? 'SMS Code Failed to Send…' : 'Enter verification code' }}

{{ completedStep1 ? 'Authentication & Security' : content.trialHeading.replace('{0}', user.FirstName) }}

{{ content.upgradeHeading.replace('{0}', user.FirstName) }}
The email address you entered is registered with InvestSMART
Please login to continue
We have sent you an email with the details of your registration.
Looks you are already a member. Please enter your password to proceed
{{ upgradeCTAText }}
Updating information
Please wait ...
Your membership to InvestSMART Group recently failed to renew.
Please make sure your payment details are up to date to continue your membership.
Having trouble renewing?
Please contact Member Services on support@investsmart.com.au or 1300 880 160
You've recently updated your payment details.
It may take a few minutes to update your subscription details, during this time you will not be able to view locked content.
If you are still having trouble viewing content after 10 minutes, try logging out of your account and logging back in.
Still having trouble viewing content?
Please contact Member Services on support@investsmart.com.au or 1300 880 160
Please click on the ACTIVATE button to activate your Intelligent Investor 15-day free trial
Please click on the ACTIVATE button to finalise your membership
Unsuccessful registration
Registration for this event is available only to Eureka Report members. View our membership page for more information.
Registration for this event is available only to Intelligent Investor members. View our membership page for more information.
- You are already registered for this event.
- This event is already full.
- Please select a quantity for at least one ticket.
- {{ i }}
Forgotten password
Please enter your email address below to request a new password
- Indepth analysis of ASX listed shares
- BUY, Hold and Sell Recommendations
- Ideas Lab
- Special Reports
- Alan Kohler’s Weekend Briefing
- Interviews with CEO’s & top influencers
- Money Cafe and Talking Finance
- Super Advice and Q&A with Ask Alan

John Addis
Mind the income gap
The past, said novelist LP Hartley, is a foreign country. For me, growing up in 1970s England, it seems like a different planet. Coming home from school in 1974, I'd find my mum lighting candles. She had hippie tendencies but that wasn't it. Inflation was out of control, a currency crisis loomed, and Prime Minister Ted Heath had declared a three-day week. At about 5pm the lights went out and that was that.
The dispute had its genesis with the coal miners, who at the time had a few modest demands, including a 35 per cent pay increase and the nationalisation of all land and the country's biggest monopolies. The UK grid was powered by coal and, with the miners on strike, I had to eat my fish fingers in the darkness. I still have no idea how she cooked them. English-style perhaps, thawed over a naked flame? It was a foreign country alright.
Except for the release of The Clash's first album, not much improved in the years that followed. By the end of the decade rubbish was six-feet high in Central London. In Liverpool, the local council had to rent an empty building near the airport to house the unburied dead. After a few weeks, the gravediggers settled on a 14 per cent increase and picked up their shovels. The period came to be known as the Winter of Discontent, but it felt longer than that. When I arrived in Australia in 1988, the place felt miraculous, a glorious impossibility, and in many ways still does.

Leicester Square, London c1978
And yet despite the racism and sexism of '70s TV shows like Love Thy Neighbour and Till Death Do Us Part, even in a strike ridden, rancid UK there was a sense that we would live better, more prosperous lives than our parents, and our children better lives than ours.
Anyone with a half-decent job could afford a house; healthcare and tertiary education were free and train travel was grotty but affordable. Assuming they weren't playing away, dads also got home by six, leaving a few hours for family time, or drinking. I'd say my generation (I'm 53, demonstrably so) probably had the last of the best of it.
I recite this personal history not as an indulgence, although it may be that, but to illustrate a point that's driving contemporary politics, one that will ultimately affect capital returns. Over the last 30 years many people's lives have gone backwards, and they appear to have had enough of it.
When economists talk about national income, they do so in terms of capital and labour (the terms are not expressly Marxist, so you can stop typing now). The late 1970s was a high point in labour's share of national income. Since then it's been all downhill, reaching a point where it threatens political stability.
For my money, income inequality rather than racism, immigration and identity politics is the primary reason for our predicament; Trump, Brexit, Hanson and the anti-globalisation wave on which they have travelled is an expression of the problem, not the problem itself.
So, what happened?
First, starting with Thatcher and Reagan, the notion of government as a force for good in society slowly withered. In its place is a semi-religious belief in the power of market forces to solve all our problems. Industries have been privatised and opened up to global competition; trade barriers were pulled down and unions weakened.
This made some sense. A government need not own an airline or a telco, although as it happened we swapped one inefficient public owned monopoly for a rapacious private one. But the theory had merit. Capitalism without competition is not worthy of the name. Unions, too, had become belligerent. My grandfather loved to tell the story of how he was called out on strike because mine management had moved the tables in the staff canteen.
The lowering of trade barriers and the entry of China to the World Trade Organisation in 2001 was equally consequential. Companies swapped labour in high-cost countries for those with lower costs, shipping the products back and selling them at lower prices. Jobs were created in the East at the expense of those in the West.
Long-term trends in value and volume of merchandise exports
1950-2010 (Index numbers, 2000=100)
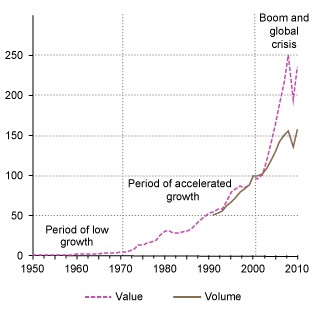
Source: UNCTAD
Second, technology has also lowered prices, although there's disagreement about its extent. But if you think about how one gadget – the smartphone – has replaced fax machines, music players, cameras, CDs, watches, maps, books and slide projectors, you get a feel for its impact.
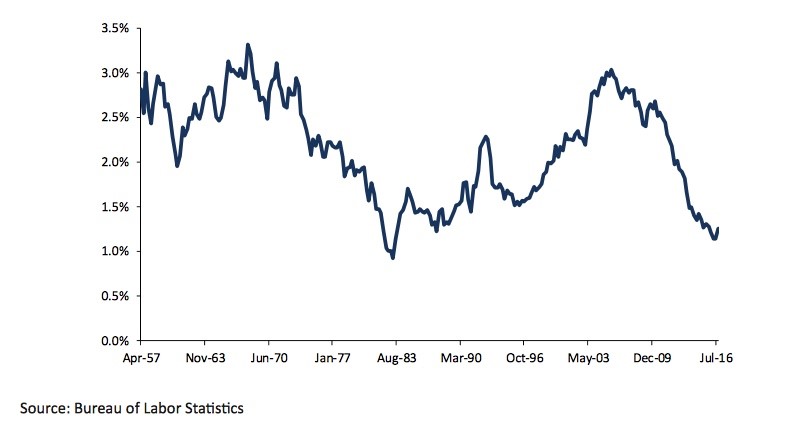
Improvements in productivity are the biggest source of economic growth, but recent developments have upended entire industries, spawned others and propagated knowledge in a way not previously seen. There's a caveat, though. Although technological advance can power productivity growth, in the US and Australia over the last decade it has been falling, and no one really knows why. A story for another day perhaps.
10-year trailing US productivity growth
Third, governments have been eager to reward the so-called lifters and punish the much maligned leaners. Free tertiary education went years ago (ironically killed by politicians that benefited from it) but welfare, which was meant to help people doing it tough, was extended to the middle classes and up, along with lower marginal tax rates, capital gains tax discounts and the tax deductibility of interest.
Corporate tax rates have also been cut. Many Western countries, including Australia, have tax systems that favour capital gains over ordinary income.
The combined effects of these policies are many, but they're neatly summed up in these two charts below (both use US figures):
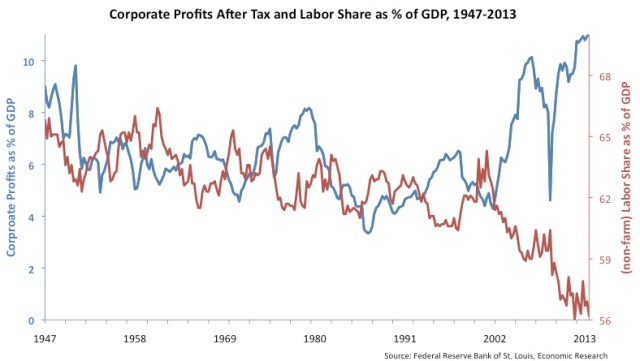
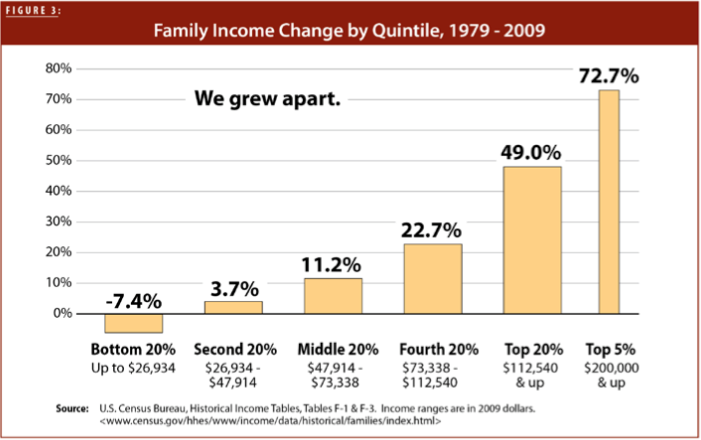
The first shows how the US labour share of GDP has declined, especially since the turn of this century, compared with the rise in US corporate profits. The second – again US figures, we'll get to Australia in a moment – shows how the benefits of globalisation and the reversal of a progressive tax system have affected income distribution. Note that this chart only goes to 2009. Of the income gains since then, 95 per cent have gone to the top 1 per cent.
This chart from the Center for Economic Policy and Research sums up the effects of events on the very richest US citizens (remembering that correlation is not causation):
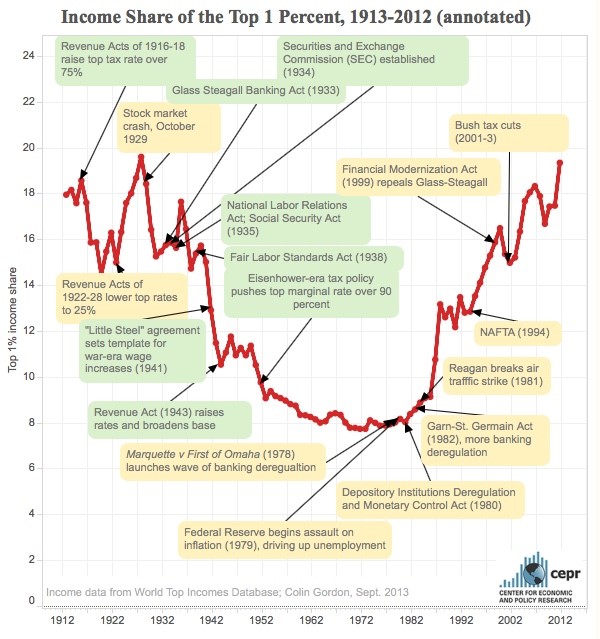
It turns out that while I was a kid stumbling around in the dark, the top 1 per cent in the US were doing it tough and inequality was the lowest it had been since the roaring 1920s.
Over the past 30 years that situation has reversed. Remember Mitt Romney, a former future President of the United States? Well, his Mexican-born father George also ran for President, in 1968. His tax returns showed an average marginal tax rate of 37 per cent – high by today's standards but low considering the top marginal tax rate in 1955 was 91 per cent (it fell to 50 per cent in the 1970s). Mitt's effective tax rate on the $US21m he earned in 2010 was 15 per cent. His father, a CEO in the automotive industry, earned about four times the average worker's weekly pay. In 2010, the figure for Mitt was over 500 times.
Warren Buffett famously asked the staff in his office to work out their effective marginal tax rate. In looking at the results, Buffett noted his was lower than his secretary's, subsequently telling The New York Times that “there's class warfare, all right but it's my class, the rich class, that's making war, and we're winning.” This is the third-richest man in the world remember, not a 1970s union rep with a dacha outside Moscow. Assuming you're up for it, this chart offers the chance of a little more outrage.
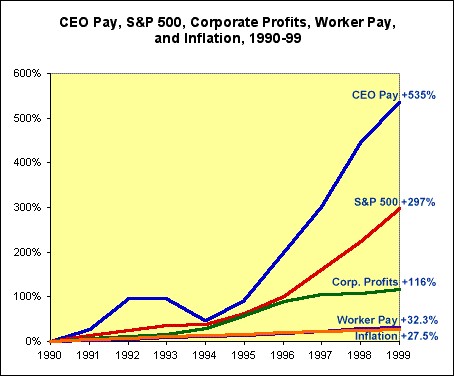
Sources: see here
So, of the three possible explanations for rising inequality – globalisation, technological development and the repeal of progressive tax systems – which is the major culprit? And is Australia suffering in the same way as the UK and the US?
The chart below, based on a paper titled The top 1 percent in international and historical perspective (via the National Bureau of Economic Research) plots the percentage change in the income share of the top 1 per cent against the change in top marginal tax rates.
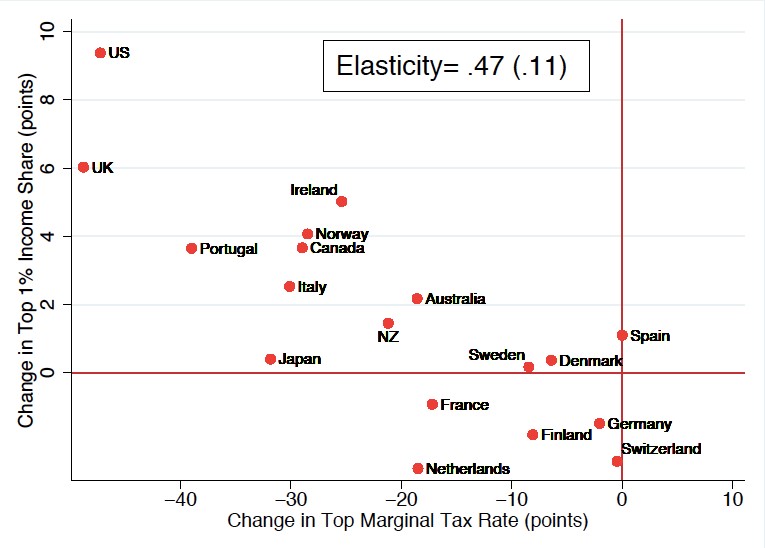
Source: NBER, Alvaredo et al (2013)
The fascinating thing about it is that all the countries noted are subject to the forces of globalisation and technological advance. But those that have slashed top marginal tax rates the most – the UK and US – are also those where the top 1 per cent have captured the greatest growth in income.
Again, this isn't causation – there may be other forces at play – but it might suggest those blaming globalisation for income inequality could be off-target. Globalisation has created a stunning increase in global wealth; that the wealth has been distributed unevenly may not be globalisation's fault. Government policy, and the impact on governments of vested interests, might have something to do with it.
What about Australia? We're in the middle of the pack, closer to Sweden and Denmark than the red meat Anglosphere. But that's not to say we don't have a problem.
Our tax system heavily favours capital gains over ordinary income and, as the ABC has reported, company profits recently jumped to record highs. Meanwhile, wages growth is at record lows. The growth in personal debt has offset what might have been a contraction in consumption but that can't last forever. And while the Business Council campaigns for a corporate tax rate of 25 per cent, the ATO's transparency report shows they've already got it. BCA members paid just 24.3 per cent in 2014-15. There isn't much room for complacency.
Finally, to the big one. Why should we or anyone else care about income inequality?
The moral argument is straightforward; in a world of plenty everyone deserves a decent life and equal opportunities to better themselves. Think of it as an economic version of the Golden Rule, a foundation of all major religions – treat others as you would like to be treated. Simple.
The long answer is given in a mammoth 336-page OECD report titled In It Together – Why Less Inequality Benefits All. The premise rests on the philosophical concept of enlightened self-interest. I'll save you the trouble of reading it. In essence, growing inequality and higher concentrations of wealth harms economic growth and limits investment opportunities, and that's bad for everyone.
Enjoy the weekend, and maybe tip the waitress.
Readings & Viewings
In a week where the US stock market hit fresh record highs – a reaction to President Donald Trump's address to Congress on Wednesday (Australian time) where he again revealed little of the detail around his bold economic plans – it seems that anything was possible.
Which is why it didn't come as a total shock to see the loss-making photo sharing and messaging app Snapchat list on the market at a whopping valuation of $US24 billion. But many investment analysts are questioning whether the price is just an apparition.
Anyway, maybe you're looking in the wrong investment corner. Gold has been attracting strong interest, but now Bitcoin is trading above the precious metal.
Maybe some of these people are Bitcoin investors? An estimated 11,000 millionaires moved to Australia in 2016, making it the top destination for millionaires.
They say the buck always stops at the top, and Yahoo is no exception. The company's CEO Marissa Mayer has lost her annual $US2 million bonus as a result of overseeing a known security hack. And heads have rolled too, with Yahoo's top lawyer resigning over the scandal.
Michael Jackson's Neverland ranch is back on the market, and it's been discounted by a whopping $US33 million from two years ago.

Meanwhile, veteran investor Carl Icahn is exiting the Trump Taj Mahal casino in Atlantic City at a hefty loss.
You may have heard US President Donald Trump single out Harley Davidson in his Wednesday address to Congress as an example of one US company being hurt by trade tarrifs. What he neglected to mention was that his decision to exit the Trans-Pacific Partnership will hurt Harley more.
Talking of transportation, Melbourne freeway commuters are becoming used to being driven crazy of late as a result of organised protests by licensed taxi drivers against rival service Uber. But that's just the tip of the iceberg, and Uber founder Travis Kalanick is feeling the heat on multiple levels.
But if you prefer walking anyway, why not order your pizza from your shoes with a press of your tongue?
But some in the UK, such employees from Boots and Ford, are getting the boot the hard way.
Australian governments have been racking their brains over how to solve our housing affordability situation. Maybe the mayor of Vancouver has the answer?
Lastly, could this be another trigger to exit the UK? Drinkers of Scotland's Irn Bru are up in arms, over a cut in sugar content.

Last Week
Shane Oliver, AMP Capital
Investment markets and key developments over the past week
The past week saw US, European and Japanese shares rise helped by strong US forward looking data, signs that the Fed is increasingly confident in the US outlook and confidence that President Trump is in on track with his pro-business agenda. By contrast Australian and Chinese shares fell. Bond yields generally rose as the probability of a March Fed rate hike rose and this also saw the US dollar rise which in turn put downwards on commodity prices and the Australian dollar.
Despite much anticipation President Trump's Congressional address provided little detail on his pro-business policies but he made plenty of references to deregulation, corporate and personal tax cuts and infrastructure spending and he sounded more presidential. As a result share markets remained happy. Interestingly the Trump Administration also sent to Congress its trade policy agenda which made reference to pursuing bilateral trade deals and renegotiating existing deals but does not signal the widespread application of tariffs, which adds confidence to the view that a trade war will be avoided.
There was more interest in relation to the Fed, where comments by various Fed officials that it should move “soon” to raise rates again and that the risks were “starting to tilt to the upside” saw the money market's implied probability of a March rate hike rise to 90 per cent. Given the run of strong US data and with the New York Fed President Dudley also joining the fray, we have moved our timing for the next Fed rate hike from May/June to March. If this were happening a year ago share markets would have gone into a tailspin. But because the US economy is stronger now, the Fed's confidence in the outlook actually seems to be supporting the share market. After the strong gains since the US election, the likelihood of a short term share market correction remains high. That said the US share market seems to be following the pattern seen in previous rate hiking cycles, i.e. pullback around the first hike (February 1994, June 2004 and December 2015) and then rallying into and through subsequent hikes because the economic data is better. Back in the 2004-2006 tightening cycle rates were going up at every Fed meeting and it took 17 hikes to ultimately kill the bull market off. A March hike would potentially open the door to four as opposed to three Fed hikes this year, but compared to the 2004-2006 rate hike cycle, this time around the tightening process is likely to be a lot slower reflecting still constrained GDP growth (so far March quarter growth looks like being below 2% again), still low wages growth and the strong and rising US dollar.

Source: Bloomberg, AMP Capital
- The OECD is right to warn about Australian house prices, excessive household debt and the risk to the economy. Such risks are real, particularly with Sydney home prices up 73% over the last five years against wages growth of just 13%. Housing – both affordability and the nexus of excessive home price and household debt growth – remains Australia's Achilles heel. It's worth noting though that such warnings have been issued continuously since 2003 and the yet the property market keeps on keeping on. Our view remains that unit prices in some oversupplied areas will fall 15-20% at some point and that a 5-10% cyclical downturn in average home prices is likely once interest rates start to rise. But it remains hard to see a generalised home price crash in the absence of: much higher interest rates causing a wave of defaults (but the RBA is not going to raise interest rates until it gets to that point); a surge in unemployment (of which there is no sign at present); and a continuing surge in supply (but building approvals look to have peaked). While the property market is proving even stronger than I thought, my views on the risk of a property crash are unchanged from those in this note.
Major global economic events and implication
US economic data was mixed – but where it really counts in the forward looking indicators it was strong. On the soft side December quarter GDP growth was left unchanged at 1.9% annualised, pending home sales fell, construction fell, real consumer spending fell in January and the trade deficit widened. But more importantly, consumer confidence rose to its highest since 2001, unemployment claims fell to their lowest since March 1973 and the ISM manufacturing conditions index rose to a strong 57.7 with surging new orders.
In the Eurozone economic confidence rose to a new six year high adding to the message from business conditions PMIs that growth is likely to accelerate. Meanwhile headline inflation rose to 2% yoy in February on higher energy prices, but core inflation remained stuck at 0.9%.
Japanese industrial production fell in January but a rising trend in the manufacturing conditions PMI points to a rebound going forward. Labour market data was strong, but household spending was weak and core inflation remained low at 0.2% yoy – but at least it's up from 0.1%. The BoJ remains a long way away from tightening.
Chinese manufacturing conditions improved in February and services conditions held strong consistent with growth remaining solid.
Rising export momentum across Asia – with Korean exports up 20% yoy – is consistent with the stronger global growth theme. Even Indian GDP growth surprised on the upside in the December quarter, despite “demonetisation”.
Australian economic events and implications
The Australian economy saw some good news with December quarter real GDP rebounding by a greater than expected 1.1% quarter on quarter, robbing the doomsters from being able to declare a recession. The rebound in real growth was broad based across consumer spending, public demand, housing investment, business investment and trade. Nominal growth was also strong reflecting higher commodity prices which in particular supported profits. While growth will likely slow back a touch in the current quarter on slower consumer spending and trade it's likely to be close to 3% through 2017. In other data, the trade surplus fell sharply in January but this looks to be due largely to temporary factors including the early timing of the Chinese New Year holiday and a slump in volatile gold exports. Building approvals rose slightly in January and new home sales fell slightly but the trend is down in both pointing to a loss of momentum in housing investment. House price growth though stayed uncomfortably strong in Sydney and Melbourne in February according to CoreLogic adding to RBA wariness about cutting rates again.
The Australian December half profit reporting season wrapped up and left listed company profits on track for a 19% rise this financial year after two consecutive years of falls. The profit turnaround has all been driven by resources companies which are on track for a rise in profit of 150% this financial year reflecting the benefits of higher commodity prices and volumes on a tighter cost base. Profit growth across the rest of the market is likely to be around 5% but it should accelerate in 2017-18 as economic growth improves.
Shane Oliver is chief economist at AMP Capital.
Next Week
Savanth Sebastian, CommSec

Reserve Bank and retail spending to draw the most focus
The ‘Autumn Avalanche' continues into its second week. Domestically a number of key economic data pieces will be released including retail trade (sales). Also the Reserve Bank Board meeting takes place. There is plenty to watch overseas including Chinese inflation (Thursday) and the key US employment report (Friday).
In Australia, the week kicks off on Monday with the release of the retail spending data for January. No doubt the latest figures will garner plenty of interest given the slowdown in retail activity in December. The Commonwealth Bank Business Sales index indicated that sales recorded modest growth in January. For the record we expect that retail sales rose by 0.5 per cent in January.
Also on Monday, data on job advertisements is issued. In the past this was a trusted gauge of labour demand but nowadays more people are going straight to company websites and using social media to scour for available positions. Job advertisements rose by 4 per cent in January to a five-year high. It was the strongest monthly rise in ads in 2½ years. Job ads are up 7.1 per cent on a year ago.
The Reserve Bank Board meets on Tuesday and it is a pretty safe bet that interest rates will be left unchanged. Financial market volatility remains subdued, oil prices are steady; and the Aussie dollar has lifted – albeit marginally. And on the global front, economic conditions are certainly healthier. Importantly investors will continue to focus on the statement accompanying the interest rate decision. Once again housing and the currency will draw the most interest.
Also on Tuesday, the Australian Industry Group releases the Performance of Construction index while Roy Morgan and ANZ release the weekly consumer confidence reading. Confidence levels remain healthy, up 7 per cent over the year. Notably, consumers believe their finances are in good shape and are expected to stay in good shape.
On Friday home loans (housing finance) data is released. The home loan data may prove a surprise with data from the Bankers Association indicating that the number of owner-occupier home loans may have fallen by 2.5 per cent in January while investment lending may have fallen by 2 per cent. It is clear that potential home buyers continue to upgrade their homes, albeit at a slower pace than witnessed last year. Interestingly home prices are lifting at a rapid pace particularly across in Sydney and Melbourne.
US and Chinese data: Spotlight on US employment and China trade
There is plenty of data to watch in the US; however the “star” of the US monthly economic data calendar is the non-farm payrolls (employment) figures. And those job figures are released in the coming week on Friday.Economists expect that the good run of results continued in February with 175,000 jobs created. Apart from the jobless rate, the other indicator in the report that will be scrutinised will be the measure of wages. If wages are starting to lift, the Federal Reserve will feel more comfortable continuing the process of “normalising” interest rates.
In terms of the other indicators, the procession starts on Monday with data on factory orders and the final reading on durable goods orders – a proxy for business investment. Factory orders are expected to have risen by 1 per cent in January.
On Tuesday, the trade balance and consumer credit data are released. A trade deficit of around $46 billion is expected while consumer credit should have risen by $20 billion in January.
On Wednesday, the February figures on private sector employment from ADP are due. Economists tip an 180,000 rise in private sector jobs.
Also on Wednesday the second reading on December quarter non-farm productivity and wholesale inventories are released. Productivity should have lifted at a 1.5 per cent annual rate.
On Thursday the usual weekly data on jobless claims is released alongside household wealth data for the December quarter. In the September quarter household wealth rose by $1593 billion. The lift in house prices and rising sharemarkets should continue to lift wealth levels in the December quarter.
And on Friday, the February data on employment is released – the non-farm payrolls data. As stated earlier, economists expect that 175,000 new jobs were created in February. Also, the unemployment rate may have eased from 4.8 per cent to 4.7 per cent. In addition, on Friday the monthly budget statement is released.
In China the National Bureau of Statistics releases trade data on Wednesday and inflation data on Friday. While both exports and imports are down on a year ago, most focus is on imports as a measure of domestic spending. The trade surplus should hold near $51 billion for February although the timing of Chinese New Year could add a degree of uncertainty to the outcome.
In terms of inflation, it is notable that business inflation – producer prices – is now lifting. In fact, annual growth of producer prices rose to a 5½-year high of 6.9 per cent in January. And consumer prices rose to a 2½-year high of 2.5 per cent in the year to January.
Sharemarkets, interest rates, exchange rates and commodities
The Australian profit reporting season has come to a close. CommSec has analysed all results from ASX 200 companies. In short, the earnings season has been good. Very good. Only eight companies from the ASX 200 have produced a statutory loss for the six months to December.
- Excluding BHP Billiton, aggregate profits rose by 36 per cent to $25.3 billion while aggregate cash holdings of all ASX 200 reporting companies rose by 11 per cent on June levels to $110 billion. Of companies paying a dividend, 68 per cent lifted dividends; 14 per cent maintained dividends; and almost 19 per cent of companies cut dividends. Recently many were surprised by survey results that showed that business conditions are the best in nine years. The earnings results confirm that Corporate Australia is in good shape.
Savanth Sebastian is a senior economist at CommSec.

