
Market Watch


- {{x.value}}
{{ twilioFailed ? 'SMS Code Failed to Send…' : 'Enter verification code' }}

{{ completedStep1 ? 'Authentication & Security' : content.trialHeading.replace('{0}', user.FirstName) }}

{{ content.upgradeHeading.replace('{0}', user.FirstName) }}
The email address you entered is registered with InvestSMART
Please login to continue
We have sent you an email with the details of your registration.
Looks you are already a member. Please enter your password to proceed
{{ upgradeCTAText }}
Updating information
Please wait ...
Your membership to InvestSMART Group recently failed to renew.
Please make sure your payment details are up to date to continue your membership.
Having trouble renewing?
Please contact Member Services on support@investsmart.com.au or 1300 880 160
You've recently updated your payment details.
It may take a few minutes to update your subscription details, during this time you will not be able to view locked content.
If you are still having trouble viewing content after 10 minutes, try logging out of your account and logging back in.
Still having trouble viewing content?
Please contact Member Services on support@investsmart.com.au or 1300 880 160
Please click on the ACTIVATE button to activate your Intelligent Investor 15-day free trial
Please click on the ACTIVATE button to finalise your membership
Unsuccessful registration
Registration for this event is available only to Eureka Report members. View our membership page for more information.
Registration for this event is available only to Intelligent Investor members. View our membership page for more information.
- You are already registered for this event.
- This event is already full.
- Please select a quantity for at least one ticket.
- {{ i }}
Forgotten password
Please enter your email address below to request a new password
- Indepth analysis of ASX listed shares
- BUY, Hold and Sell Recommendations
- Ideas Lab
- Special Reports
- Alan Kohler’s Weekend Briefing
- Interviews with CEO’s & top influencers
- Money Cafe and Talking Finance
- Super Advice and Q&A with Ask Alan

We're wrapping up week two of the ‘new market order’ of higher volatility and renewed concerns around US rate trajectories. US equity markets looked through the rises and logged five consecutive days in the green with the Dow averaging well into the 100-point plus trading.
However, putting US equity markets aside, the macro data did raise further risk questions.
The two major international data pieces this week were the European GDP and US CPI figures.
European GDP is being touted as the ‘renaissance’ data. Europe’s return to economic growth is a signal that the ECB’s actions over the past five years are finally creating some traction, but more importantly, that global confidence is filtering into actual economic returns.
A preliminary read of 2.7 per cent year-on-year (YoY) suggests the renaissance term is clearly an accurate description and the global flowthroughs will likely come the second half of 2018.
The other international data of note was US CPI, which has a much larger impact on markets, particularly US rate markets. The core CPI YoY figure of 1.8 per cent beat expectations of 1.7 per cent and was a 10-basis point (bps) increase on the previous month’s YoY figure.
The US is on track to reach its second mandate. The 20bps gap to its 2 per cent mandate can easily be closed if average hourly earnings increase like they did in the January Non-Farm Payrolls (NFPs). US employment is only going to ramp up further with the new fiscal stimulus that has been signed off on last week. The inflation outlook is bright.
The US 10-year hit a new 4-year high of 2.94 per cent on the release of the CPI numbers. That figure is a good 5bps higher than the 2.89 per cent level that has been suggested as a trigger point for the recent market volatility which saw the Dow drop 1500 points in a single session.
The sell-off in the bond market needs to be taken for what it is; the market’s increased belief the US Federal Reserve will not only increase rates further in 2018, but with more speed and velocity than previously expected.
However, there are some that point to the fact that apparel jumped 1.7 per cent in January (there was a 3.4 per cent jump in women’s apparel) which accounted for 3 per cent of CPI, its highest level since 1990. Couple this with a weaker than expected January retail sales figure and the impact low cost outlets have had on apparel inflation over the past ten years.
Economists suggest the January figure will filter out quickly and CPI will remain below the Fed’s 2 per cent target level in the short-term. This point may explain the relatively low reaction to the CPI print in risk markets such as equities.
The inflation growth debate is one that will rage for all of 2018 and beyond.
Let’s now look to employment, the Australian data of the week. The ABS reported on Thursday that Australian employment grew for the 16th consecutive month, its longest consecutive stretch in history.
The 16,000 jobs added in the month of January on seasonally adjusted terms goes hand-in-hand with the 393,000 jobs added in 2017.
However, the headline figures mask some of the more granular issues facing employment in Australia. Full-time employment fell by 49,800 leaving all the heavy lifting to part-time, which fuelled the positive employment change by adding 65,800 jobs.
Unemployment remained at the 3-year low of 5.5 per cent, however, the biggest feed through from the employment data is represented in this chart:
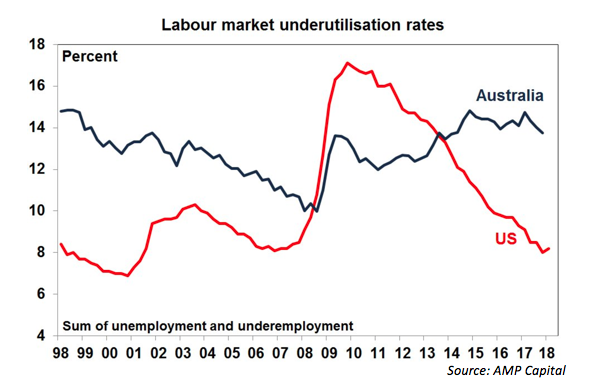
The gap between the underutilisation rate in the US and Australia is the largest it has been in 18 years. We have an underemployment problem where most of the slack continues to linger. This problem is likely to exacerbate as more and more people return to the jobs market in search of work due to increasing confidence they can find work on the back of the employment change strength; it’s somewhat a double-edged sword right now.
This will take time, and as the chart above illustrates, Australia needs the underutilisation rate to fall dramatically if we are to really follow our US peers and really see wages increase, as they have been in the past few months.
Wages growth remains a problem for the RBA, for Australia’s long-term growth, and for inflation. All attention should be on next Wednesday’s release of the wage price index to see if there are any signs of this problem abating.

