
Market Watch


- {{x.value}}
{{ twilioFailed ? 'SMS Code Failed to Send…' : 'Enter verification code' }}

{{ completedStep1 ? 'Authentication & Security' : content.trialHeading.replace('{0}', user.FirstName) }}

{{ content.upgradeHeading.replace('{0}', user.FirstName) }}
The email address you entered is registered with InvestSMART
Please login to continue
We have sent you an email with the details of your registration.
Looks you are already a member. Please enter your password to proceed
{{ upgradeCTAText }}
Updating information
Please wait ...
Your membership to InvestSMART Group recently failed to renew.
Please make sure your payment details are up to date to continue your membership.
Having trouble renewing?
Please contact Member Services on support@investsmart.com.au or 1300 880 160
You've recently updated your payment details.
It may take a few minutes to update your subscription details, during this time you will not be able to view locked content.
If you are still having trouble viewing content after 10 minutes, try logging out of your account and logging back in.
Still having trouble viewing content?
Please contact Member Services on support@investsmart.com.au or 1300 880 160
Please click on the ACTIVATE button to activate your Intelligent Investor 15-day free trial
Please click on the ACTIVATE button to finalise your membership
Unsuccessful registration
Registration for this event is available only to Eureka Report members. View our membership page for more information.
Registration for this event is available only to Intelligent Investor members. View our membership page for more information.
- You are already registered for this event.
- This event is already full.
- Please select a quantity for at least one ticket.
- {{ i }}
Forgotten password
Please enter your email address below to request a new password
- Indepth analysis of ASX listed shares
- BUY, Hold and Sell Recommendations
- Ideas Lab
- Special Reports
- Alan Kohler’s Weekend Briefing
- Interviews with CEO’s & top influencers
- Money Cafe and Talking Finance
- Super Advice and Q&A with Ask Alan

We're at the end of the first of the ‘big two’ weeks.
This week, Australia’s third-quarter GDP took centre stage. Next week is a little bigger though, with Wednesday’s FOMC meeting in the US having potentially an even greater impact on our local market.
For now, what needs to be highlighted is Australia’s third-quarter GDP figures and the October trade balance. We already covered the RBA meeting on Tuesday in Wednesday’s Economic View – in short, it was basically a 2017 sign-off, with the RBA still sitting tight on the fence of rate movements.
Q3 GDP came in at 0.6 per cent quarter-on-quarter for the year-on-year figure to settle at 2.8 per cent. This represents ‘reasonable’ growth in the post-GFC developed world.
However, the actuals were a solid miss on consensus of 0.7 per cent and 3 per cent respectively. I must highlight here that GDP is retrospective data.
Going granular with GDP
Recap time. GDP = consumption (C) Government spending (G) private spending (I) (exports – imports) net exports.
The Q3 numbers followed a pattern we’ve become quite familiar with. Public spending remains are large supporter of growth, making up over 23 per cent of GDP. In the main, net exports added solid points and private spending is finally materialising. Private spending added 1.5 percentage points to the year-on-year figure.
However, the consumption part of the equation seems a cause for concern. Consumption added just 0.1 per cent over the quarter. ‘Depleting consumption’ looks to be both a retrospective issue and a future issue, highlighted perfectly by this chart from Morgan Stanley:
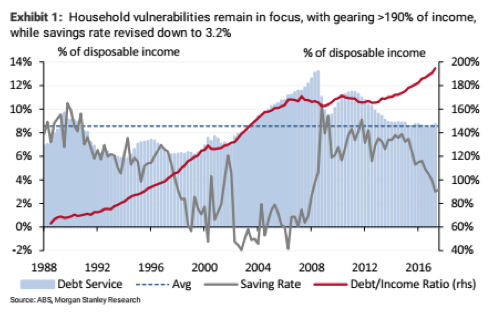
The level of savings growth is collapsing. It’s down to 3.2 per cent, the lowest read in the post-GFC era, demonstrating just how weak wage growth really is. Most of the 2.9 per cent increase in incomes came from the 2.7 per cent increase in hours worked.
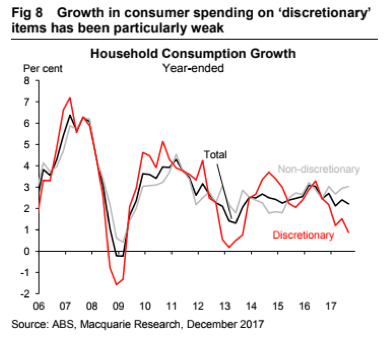
Secondly, with savings falling this fast, debt servicing is beginning to bite as the debt/income ratio jumps over 190 per cent. That means disposable income will come under real pressure in the coming year(s). Check out the trend line in this chart from Macquarie:
Trade and commodities
Looking further afield and the trade surplus figures are the first feed into net exports for Australia's Q4 GDP. As expected, terms of trade were weak, coming in at 105 million compared to September’s read of $1.6 billion and the consensus estimate of $1.4 billion.
Not concerned by this at all, the impact of the China National People’s Congress in October was felt far and wide, and I was slightly surprised to see the consensus figures for commodity prices so high.
In October, iron ore exports were down 10 per cent and coal was off 3 per cent, as imports jumped 3 per cent. The fall in trade in October has clearly reversed in November as seen by Port Hedland shipments and inventory numbers from China for November.
The questions that remain for net exports centre around value – will bulk commodity prices stay above forecasted levels in 2018? As well, will the Australian dollar fall out of bed next year adding a tailwind to US denoted earnings? Both will need to come to fruition for GDP to reach the RBA’s forecasts.

