
Market Watch, Oct. 20


- {{x.value}}
{{ twilioFailed ? 'SMS Code Failed to Send…' : 'Enter verification code' }}

{{ completedStep1 ? 'Authentication & Security' : content.trialHeading.replace('{0}', user.FirstName) }}

{{ content.upgradeHeading.replace('{0}', user.FirstName) }}
The email address you entered is registered with InvestSMART
Please login to continue
We have sent you an email with the details of your registration.
Looks you are already a member. Please enter your password to proceed
{{ upgradeCTAText }}
Updating information
Please wait ...
Your membership to InvestSMART Group recently failed to renew.
Please make sure your payment details are up to date to continue your membership.
Having trouble renewing?
Please contact Member Services on support@investsmart.com.au or 1300 880 160
You've recently updated your payment details.
It may take a few minutes to update your subscription details, during this time you will not be able to view locked content.
If you are still having trouble viewing content after 10 minutes, try logging out of your account and logging back in.
Still having trouble viewing content?
Please contact Member Services on support@investsmart.com.au or 1300 880 160
Please click on the ACTIVATE button to activate your Intelligent Investor 15-day free trial
Please click on the ACTIVATE button to finalise your membership
Unsuccessful registration
Registration for this event is available only to Eureka Report members. View our membership page for more information.
Registration for this event is available only to Intelligent Investor members. View our membership page for more information.
- You are already registered for this event.
- This event is already full.
- Please select a quantity for at least one ticket.
- {{ i }}
Forgotten password
Please enter your email address below to request a new password
- Indepth analysis of ASX listed shares
- BUY, Hold and Sell Recommendations
- Ideas Lab
- Special Reports
- Alan Kohler’s Weekend Briefing
- Interviews with CEO’s & top influencers
- Money Cafe and Talking Finance
- Super Advice and Q&A with Ask Alan

Having seen a snap out of pessimism in the consumer confidence survey due to ‘job security’ and employment makers in October, Thursday’s employment figures were either going to be confirmation of this fact or a headwind to current expectations.
However, before covering off on the employment figures – one needs to touch on the China data of the week.
The PPI figures on Monday certainly added weight to the expectations that full-year GDP in China is more likely than not to come in at 6.9 per cent for 2017. Although the Q3 figure reported on Thursday was 6.8 per cent - China is clearly looking to remain a powerhouse of growth and by default a powerhouse of bulk commodity demand, and this was illustrated in the PPI, industrial production and retail sales data of the week suggest a big push to finish the year.
However, the movements in commodity markets waned as the week progressed and the NPC took over – the question that will be answered, most likely next week, is what does the 2020 decade look like from a policy perspective? This will provide the clarity needed to understand what the next decade of the China story will look like and where Australia sits in this story.
Australian Jobs
The healthy 2017 Australian jobs prints roll on. There has now been a 335,000 jobs added on a trend base in the past year alone and if current rates remain, this will be the best year of job creation since 2005. The annual rate is now 3.1 per cent, also well above average and in the post-GFC era this figure is a standout.
The employment change has now logged 13 consecutive months of job creation; not since September 2016 has there been a decline in employment, and with the unemployment figure at 5.5 per cent the outlook for employment in Australia is on the upside.
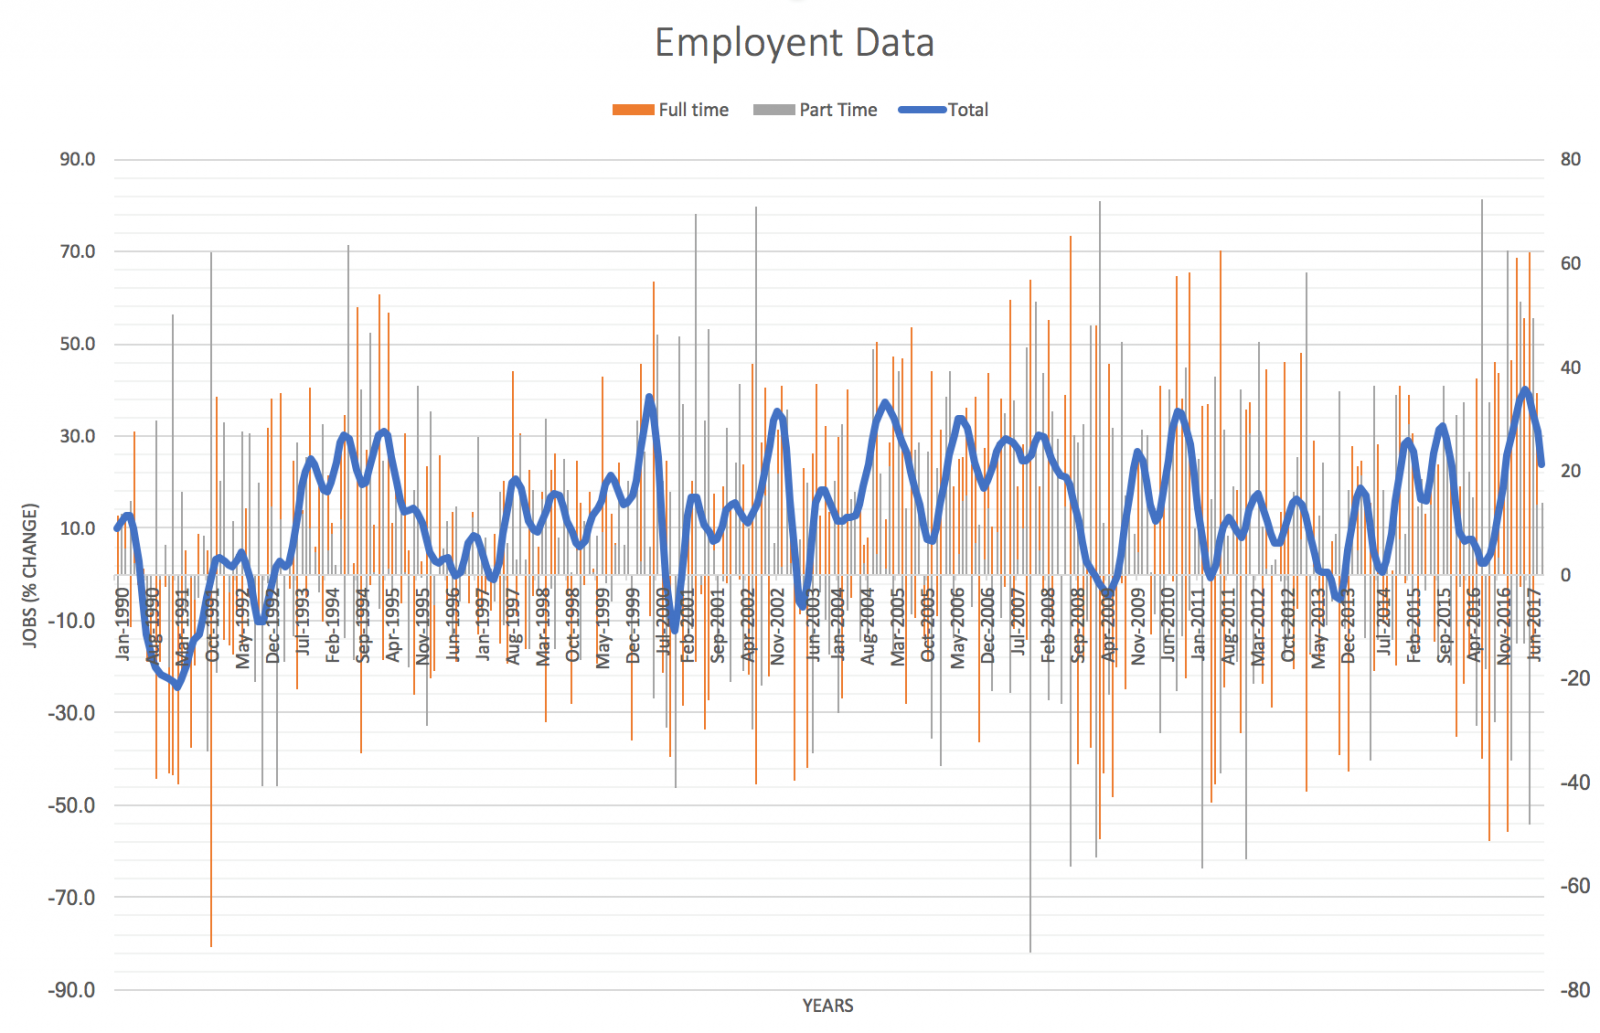
Over this time, it’s full-time creation that is the stand out and despite part-time outpacing full-time this month, the overall trend basis in 2017 is skewed to full-time. This adds further weight to the figures as seen in the chart below.
However, it’s not all roses. There is clearly still slack in the market, with underemployment at 8.6 per cent, participation lower month-on-month and year-on-year at 64 per cent, and hours worked up but not translating into wage growth.
This leads into expectations from the RBA. No doubt Lowe and Co. will have a wide smile on their faces from Thursday’s data. However, the board is unlikely to react to the employment data until it translates into wage growth as without this, its inflation targets are unlikely to be met.
Therefore - all eyes on next week’s CPI print on Wednesday for more colour.

