
Market Watch: Australian jobs and China


- {{x.value}}
{{ twilioFailed ? 'SMS Code Failed to Send…' : 'Enter verification code' }}

{{ completedStep1 ? 'Authentication & Security' : content.trialHeading.replace('{0}', user.FirstName) }}

{{ content.upgradeHeading.replace('{0}', user.FirstName) }}
The email address you entered is registered with InvestSMART
Please login to continue
We have sent you an email with the details of your registration.
Looks you are already a member. Please enter your password to proceed
{{ upgradeCTAText }}
Updating information
Please wait ...
Your membership to InvestSMART Group recently failed to renew.
Please make sure your payment details are up to date to continue your membership.
Having trouble renewing?
Please contact Member Services on support@investsmart.com.au or 1300 880 160
You've recently updated your payment details.
It may take a few minutes to update your subscription details, during this time you will not be able to view locked content.
If you are still having trouble viewing content after 10 minutes, try logging out of your account and logging back in.
Still having trouble viewing content?
Please contact Member Services on support@investsmart.com.au or 1300 880 160
Please click on the ACTIVATE button to activate your Intelligent Investor 15-day free trial
Please click on the ACTIVATE button to finalise your membership
Unsuccessful registration
Registration for this event is available only to Eureka Report members. View our membership page for more information.
Registration for this event is available only to Intelligent Investor members. View our membership page for more information.
- You are already registered for this event.
- This event is already full.
- Please select a quantity for at least one ticket.
- {{ i }}
Forgotten password
Please enter your email address below to request a new password
- Indepth analysis of ASX listed shares
- BUY, Hold and Sell Recommendations
- Ideas Lab
- Special Reports
- Alan Kohler’s Weekend Briefing
- Interviews with CEO’s & top influencers
- Money Cafe and Talking Finance
- Super Advice and Q&A with Ask Alan

The macro environment remains rather clouded as geopolitical bluster obstructs underlying economic strength.
The US-China trade wars are the clearest example of this, and current and proposed tariffs on imported Chinese goods to the US only has one real outcome – higher pricing, lower consumption and therefore lower growth.
Although the enacted tariffs will not feed through to Chinese trade data for upwards of 12 months; this week’s core indicators in retail sales, fixed asset investment and industrial production may show signs of pressure.
However, the major release from China this week is the Q2 GDP figures.
Consensus for Tuesday’s GDP release is for year-on-year (YoY) growth to maintain its slight beat on official estimates of ‘around 6.5 per cent’, with Reuters’ Smart Estimate poll seeing YoY growth coming in at 6.72 per cent. This is a slight decline from the previous month’s actual of 6.8 per cent.
However, China’s GDP is more interesting than just the headline suggests, as seen below in the deconstruct of it into the sub-categories.
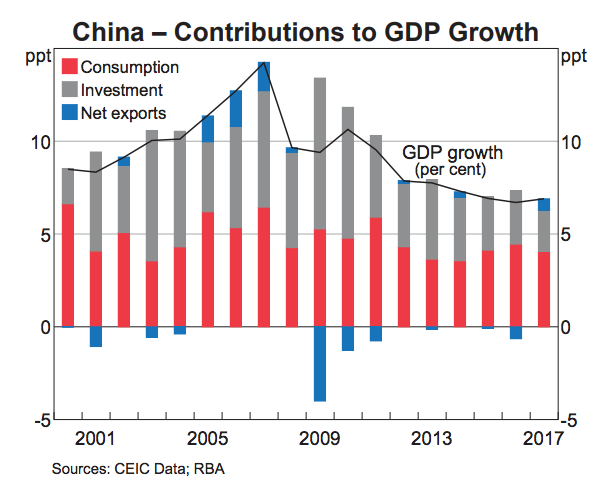
(Source: RBA Chart Park)
There are several key points here. First is that Chinese growth, although it has moderated from the double-digit growth periods of the 2000s and 2010s, has stabilised and is even showing some trend growth of late.
However, on the granular level, the switch from investment to consumption is stark, which is why consumption indicators are becoming key. Retail sales in China are forecast to come in at 9 per cent YoY for the month of June, while fixed asset investment is forecast to hold at 6 per cent. That’s after having slowed substantially over the past four years, seen here in the bottom pane of the China Activity Indicators
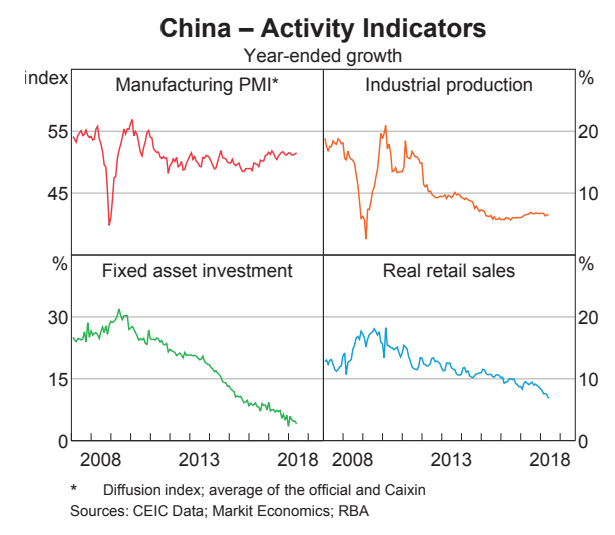
(Source: RBA Chart Park)
However, it’s the industrial production (IP) figure in the top right pane that is one of the best indicators of Chinese growth. This is a measure of all industrial output and is almost a pseudo-pulse for global consumption considering the world’s thrust for Chinese goods.
Having bottomed out in late 2015 (excluding the GFC data) IP has bounced solidly and the synchronised global growth story of 2017 and early 2018 has really boosted Chinese output of late. It’s a strong indicator for GDP as it touches several components of GDP including net exports and investment, making it a very valuable tool for understanding China’s underlying economic situation.
However, in the past two months the synchronised growth story has begun to show signs of weakness and Chinese IP will be one of the first metrics to show strain here.
It could explain why the consensus for Tuesday’s release sees IP falling month-on-month to 6.5 per cent from 6.8 per cent. Chinese IP will be a key indicator over the coming years as the trade war escalates. Tuesday will be interesting as all the discussed data will be released at the same time.
Jobs, jobs and more jobs.
After the 2017 employment boom, Australian employment growth has slowed somewhat in 2018. In the 12 months to May over 250,000 jobs were added, but in the first five months of 2018 there were only 69,400 new jobs. That means the average month job creation has shifted from approximately 20,000 jobs a month to 13,800.
Employment overall is solid and the last Reuters consensus survey has 15,000 jobs being added in June, with the unemployment rate falling to 5.4 per cent from 5.5 per cent and the participation rate to hold at 65.5 per cent.
However, what would be a real spark from the release would be any signs the official numbers are catching some of the sub-sectors seen in data, such as the NAB Business Confidence survey, the service and manufacturing PMI data, and the Private Investment survey (CAPEX).
Underutilisation falling from its 14 per cent levels would be one, and hourly earnings ticking up would be another, as the surveys mentioned have shown signs of improvement in these areas.
But the official data has not as of yet. Any movements here will be key to how the release is perceived.