
InvestSMART Australian Exchange Traded Fund Report - September 2017


- {{x.value}}
{{ twilioFailed ? 'SMS Code Failed to Send…' : 'Enter verification code' }}

{{ completedStep1 ? 'Authentication & Security' : content.trialHeading.replace('{0}', user.FirstName) }}

{{ content.upgradeHeading.replace('{0}', user.FirstName) }}
The email address you entered is registered with InvestSMART
Please login to continue
We have sent you an email with the details of your registration.
Looks you are already a member. Please enter your password to proceed
{{ upgradeCTAText }}
Updating information
Please wait ...
Your membership to InvestSMART Group recently failed to renew.
Please make sure your payment details are up to date to continue your membership.
Having trouble renewing?
Please contact Member Services on support@investsmart.com.au or 1300 880 160
You've recently updated your payment details.
It may take a few minutes to update your subscription details, during this time you will not be able to view locked content.
If you are still having trouble viewing content after 10 minutes, try logging out of your account and logging back in.
Still having trouble viewing content?
Please contact Member Services on support@investsmart.com.au or 1300 880 160
Please click on the ACTIVATE button to activate your Intelligent Investor 15-day free trial
Please click on the ACTIVATE button to finalise your membership
Unsuccessful registration
Registration for this event is available only to Eureka Report members. View our membership page for more information.
Registration for this event is available only to Intelligent Investor members. View our membership page for more information.
- You are already registered for this event.
- This event is already full.
- Please select a quantity for at least one ticket.
- {{ i }}
Forgotten password
Please enter your email address below to request a new password


- Verify your email address by clicking on the link we sent to {{user.Email}}
- You now have free access, we look forward to helping you on your financial journey.

Contents
About this report
Welcome to our inaugural Australian Exchange-Traded Funds quarterly report.
InvestSMART’s mission is to help all Australians grow and protect their wealth, by delivering education resources and a range of portfolio tools and product services.
This report provides investors with an easy-to-digest analysis of the fast-growing Australian ETFs sector. It includes the most popular ASX-listed products by funds under management, the ETFs with the highest and lowest quality ratings based on our Star Ratings process, the best and worst performers, and the prevailing trends dictating retail investment flows.
We have analysed all 157 ETFs on the Australian market, as at September 30, 2017. More investors now hold one or more ETFs in their portfolios, either directly or through managed account products. Indeed, select ETFs form the basis of a range of InvestSMART’s SMA Portfolios.
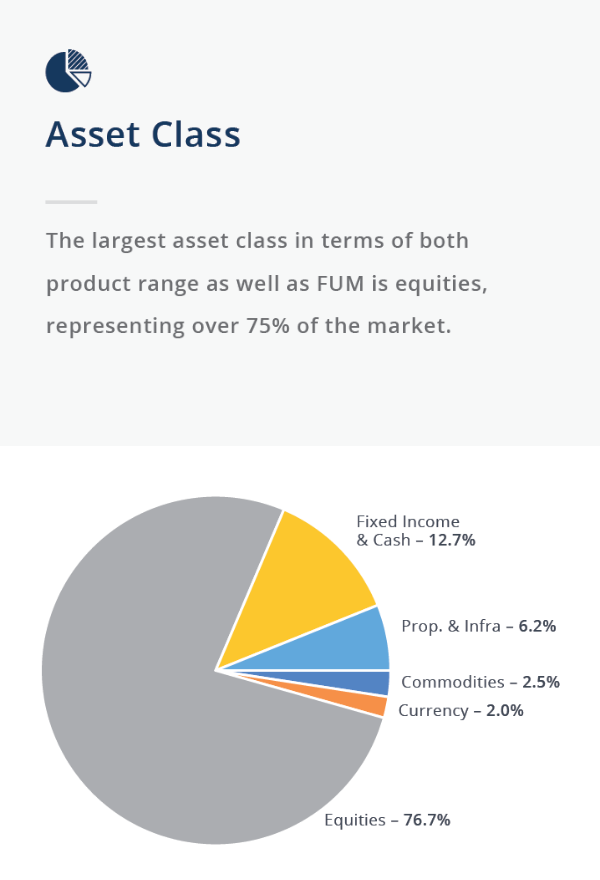
We have categorised the ETF market by asset class to allow you to quickly identify suitable securities to fill any investment gaps in your portfolio and to remain aligned to your specific investment objectives.
Figure 1: Asset Classes
| Asset Class | Description |
|---|---|
| Commodities | ETFs that provide exposure to various Commodities & Natural Resources. |
| Currency | ETFs that provide exposure to various Currencies. |
| Equities | ETFs that provide exposure to Equity Markets. |
| Fixed Income & Cash | ETFs that provide exposure to Interest Rate securities and Cash. |
| Property & Infrastructure | ETFs that provide exposure to Domestic and Global Property and Infrastructure. |
In the three months to the end of September, continued strong inflows into Australian ETFs saw a range of new products launched and total funds under management breach $30 billion for the first time.
The popularity of ETFs is a global trend. More investors are discovering that ETFs are a low-cost, hassle-free way to gain broad exposure to stock markets, specific sectors and asset classes. Rather than buying just a few stocks, one ETF security can cover an entire index, or several markets, at once.
The ability to buy ETFs directly on the market, their low cost and transparency, and achieving quick portfolio diversification through a single transaction, has seen these securities rapidly grow. But it’s important to recognise that not all ETFs are created equal. Put simply, some are better – and safer – than others.
This report will guide you through the ETFs maze. We hope it will help you get to grips with this much misunderstood area of the market and assist you in making better investment decisions.
Ron Hodge
Managing Director
About InvestSMART
Founded in 1999, InvestSMART Group Limited (ASX:INV) believes everyone should have the confidence to control their financial future and it shouldn’t be hard or expensive to do so.
Whether you’re managing your own investments or looking for a little help, we deliver straightforward, flexible and affordable solutions to ensure you are better able to meet your investment goals.
Our three leading brands – InvestSMART, Eureka Report and Intelligent Investor – together offer actionable investment tools, wealth advice and independent ASX-listed stock research.
We’re all about making investing simple. Statistics show four in five Australians do not receive any professional investment advice, with cost the primary reason. We aim to change that.
Through our Portfolio Manager, stock research, wealth commentary and affordable investment products, we believe we are delivering the right tools to help all Australians grow and protect their wealth.
InvestSMART Star Rating
When reviewing an ETF there are some key metrics common to every security. Our quantitative 5 Star Rating System takes each of these items into account, reflecting the process we use to identify investments in InvestSMART’s ETF-based Portfolios.
We have categorised the ETF market by asset class to allow members to quickly identify suitable securities to fill any investment gaps in their portfolio and remain aligned to their specific investment objectives.
Figure 2: InvestSMART Star Rating Criteria
| Factor | Description |
|---|---|
| Size | Funds under management. |
| Fees | Fund management fees as a percentage of FUM. |
| Liquidity | Trading volumes. |
| Spread | The average percentage difference between the bid & ask. |
| Tracking error | The difference in the return profile of the Fund to its benchmark. |
For our portfolios, we generally like to see a 4 to 5-star rating. This implies the security rates highly across each of the above-mentioned metrics. However, the star rating is best used as a filtering tool when comparing ETFs with the same objective.
It does not make sense to compare a highly liquid, and hence low-cost S&P 500 ETF, to one designed to track the performance of emerging markets, which are often less liquid and more expensive to access.
As the table below shows, only four Australian ETFs out of the total of 157 listed funds achieve the maximum 5 Star Rating. The bulk of ETFs are rated 3 Stars or less.
It should also be noted that the InvestSMART Star Rating is a quantitative measure and it does not take personal investment objectives into account. It does not constitute a recommendation.
Figure 3: Number of ETFs per star rating
| Star Rating | Number of ETFs |
|---|---|
 5 5 |
4 |
| 4 |
23 |
| 3 |
66 |
| 2 |
60 |
| 1 |
2 |
| NA | 2 |
What is an ETF
The first ETF - an open-ended investment fund that is traded on a stock exchange - listed on the Toronto Stock Exchange on March 9, 1990.
The TIPs (Toronto 35 Index Participation Fund) was designed to track the TSX 35 index. The listing was almost three years before the first US ETF listing (the SPDR S&P 500 ETF) and 11 years before the first Australian ETF listing, the SPDR S&P ASX 200 ETF (STW), in August 2001.
Today, the global ETFs sector is estimated at more than $US4 trillion, with more than 2,000 products traded and inflows totalling around $US2 billion per day.
Most ETFs aim to track the performance of an index or an asset class, less fees, offering access to a range of asset classes and investment strategies that ordinary investors were previously unable to reach easily or cheaply. Examples include international equities, fixed income securities and currency markets.
However, there are a growing number of products with an active element to their portfolio construction, generally referred to as “Smart Beta” products.
Figure 4: ETF Creation/Redemption process
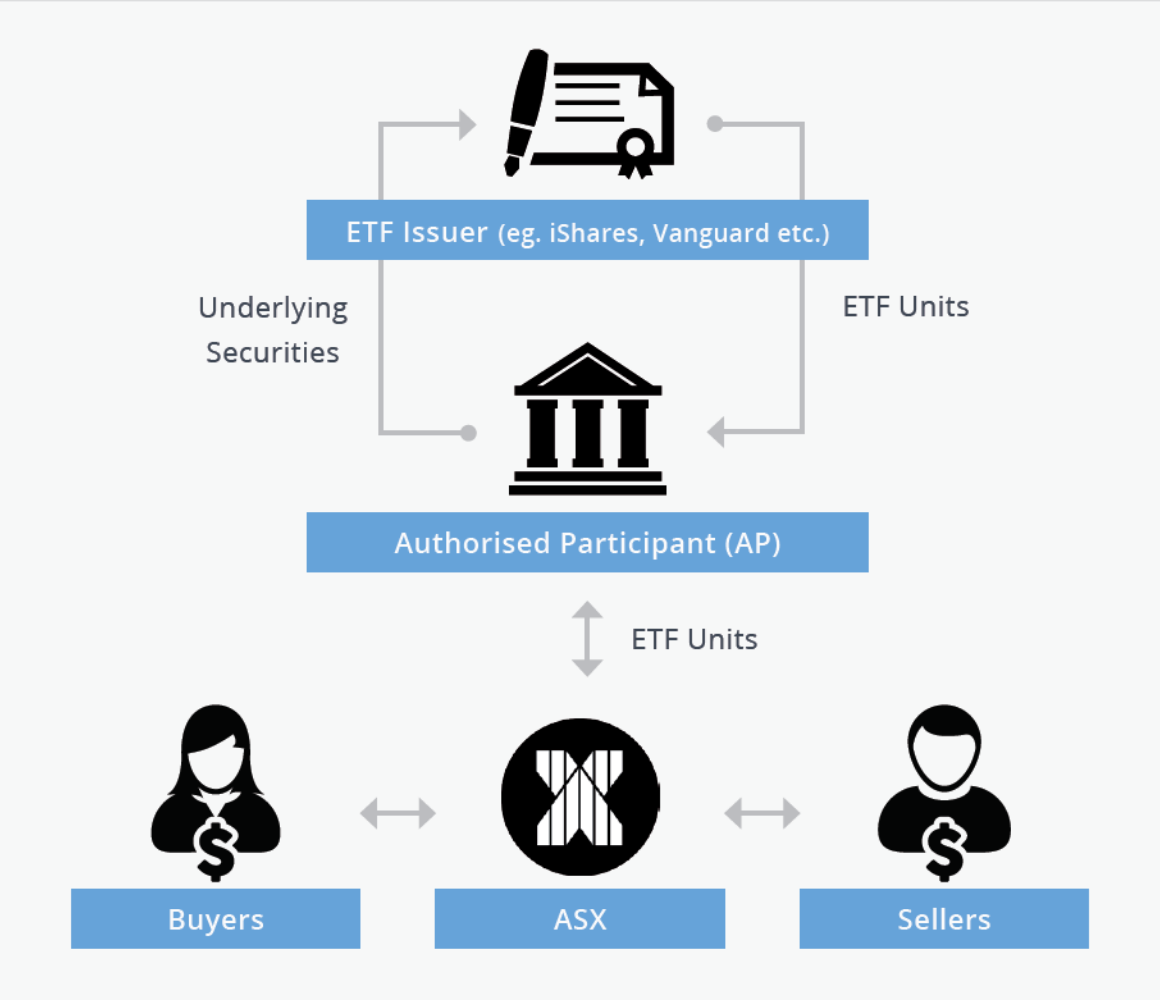
Authorised participants provide a market-making function in the ETF market, which ensures liquidity and allows issuers to keep costs low as they don’t need to physically buy/sell the underlying securities.
In buying the underlying securities of the fund and then delivering them to the ETF issuer (BetaShares, State Street, Blackrock, Vanguard, Van Eck etc) authorised participants receive units in the fund which they then place on-market for investors to purchase. The reverse is true in the case of redemptions.
ETF Advantages
Accessibility - You can purchase or redeem units in an ETF at any time during the market hours in the same way as you would for any ordinary share. This means no additional paperwork or unnecessary delays like with unlisted managed funds.
Transparency - Unlike traditional actively managed funds, most ETFs are required to publish a list of their holdings each day.
Cost Effective - Designed to track a specific index or other rule-based methodologies, fees are (on average) lower than a traditional actively managed fund.
Liquidity - Given their open-ended structure, an ETF can be as liquid as its underlying constituents.
Market Overview - FUM
Australia’s ETF sector is growing rapidly. More and more investors now hold at least one ETF in their share portfolio.
This new capital and strong asset gains, particularly from US equity markets, has added more than $6.5 billion to total ETF funds under management (FUM) so far this calendar year.
This includes an additional $2 billion over the three months to September 30, driven by inflows to equity focused ETFs. The total value of the Australian ETF sector is now almost $32 billion, with expectations of it being worth $35 billion by the end of 2017. That’s a 40 percent growth rate over the full 12 months.
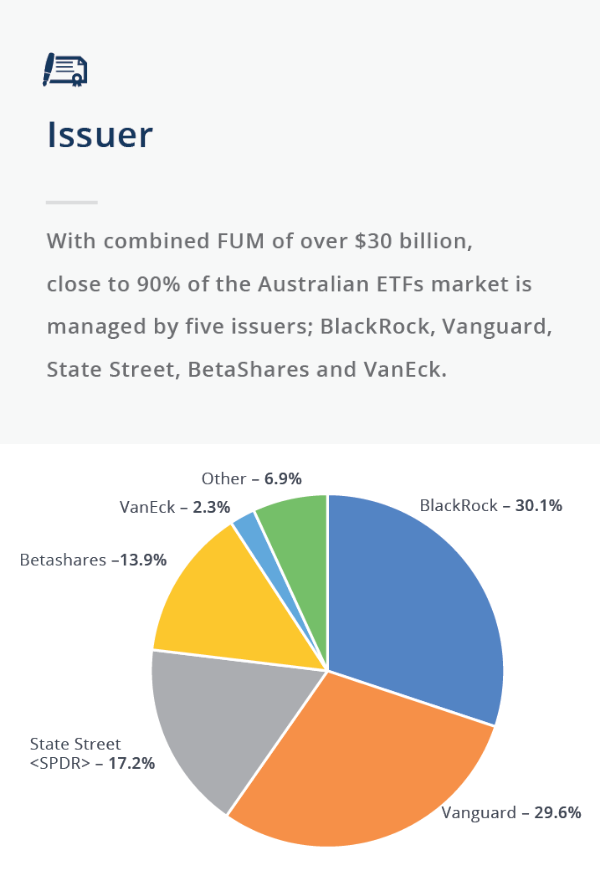
Figure 5: ETF Market breakdown by issuer
| Issuer | No. Products | Current FUM ($m) | Market Share |
|---|---|---|---|
| BlackRock | 39 | 9,147.23 | 30.10% |
| Vanguard | 17 | 8,992.92 | 29.59% |
| State Street <SPDR> | 16 | 5,232.02 | 17.22% |
| Betashares | 40 | 4,227.48 | 13.91% |
| VanEck | 10 | 706.56 | 2.32% |
| Russell | 6 | 621.96 | 2.05% |
| ETF Securities | 5 | 607.94 | 2.00% |
| UBS | 9 | 271.50 | 0.89% |
| Market Vectors Investments | 1 | 265.37 | 0.87% |
| Market Vectors Trust | 3 | 114.81 | 0.38% |
| ANZ/ETF Securities | 10 | 160.81 | 0.53% |
| Schroder | 1 | 41.90 | 0.14% |
| 157 | 30,390.49 | 100.00% |
Source: ASX and Morningstar
New ETF products continue to be launched. At the end of September there were 157 separate ETFs listed on the ASX. During the September quarter there multiple new listings across property and infrastructure, equities, and fixed income & cash.
Figure 6: New ETF Listings
| Security | Asset Class | Focus |
|---|---|---|
| ROBO | Equities | Provide exposure to Global Robotics and AI companies |
| CORE | Property & Infrastructure | Provide exposure to listed infrastructure companies from global developed market exchanges |
| BILL | Fixed Income & Cash | Aims to provide investors with the performance of the S&P/ASX Bank Bill Index |
| ISEC | Fixed Income & Cash | Aims to outperform the performance of the S&P/ASX Bank Bill Index. |
| QPON | Fixed Income & Cash | Provides exposure to senior floating rate bonds issued by Australian banks. |
| FLOT | Fixed Income & Cash | Track the performance of an index composed of U.S. dollar-denominated, investment-grade floating rate bonds. |
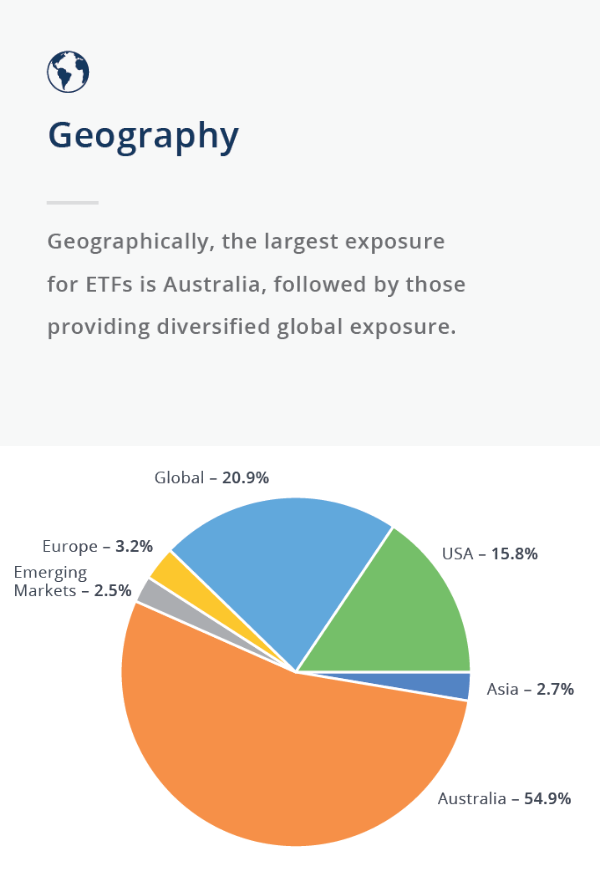
However, our research indicates investors’ assets are heavily concentrated in a handful of ETFs on the Australian market. The top 10 ETFs ranked by FUM account for almost half ($15.37 billion) of all sector assets, with the two largest funds (STW and VAS) accounting for almost 20 percent.
This reflects the home bias of most investors. The top two funds cover the Australian equities market. The third-largest (IVV) covers the top 500 companies on the US market.
These three largest funds account for more than $8 billion in investor’ funds – about a quarter of the total Australian ETFs market (see the top 10 Australian ETFs table below).
Figure 7: Top 10 ETFs by FUM
| Code | Name | FUM ($m) | Star Rating | September Quarter Inflows ($m) |
|---|---|---|---|---|
| STW | SPDR S&P/ASX 200 ETF | 3,300.2 | 5 |
–150.25 |
| VAS | Vanguard Australian Shares ETF | 2,429.8 | 5 |
480.66 |
| IVV | iShares S&P 500 ETF | 2,309.7 | 5 |
72.16 |
| AAA | BetaShares Aus High Interest Cash ETF | 1,263.54 | 5 |
17.45 |
| IOO | iShares Global 100 ETF | 1,242.29 | 3 |
52.27 |
| VTS | Vanguard US Total Market Shares ETF | 1,064.75 | 5 |
45.21 |
| VEU | Vanguard All World ex-US Shares ETF | 985.66 | 4 |
92.00 |
| VAP | Vanguard Australian Property Secs ETF | 961.68 | 3 |
59.60 |
| VHY | Vanguard Australian Shares High Yield ETF | 938.35 | 4 |
85.83 |
| IOZ | iShares Core S&P/ASX 200 ETF | 723.16 | 4 |
46.45 |
Source: ASX and Morningstar
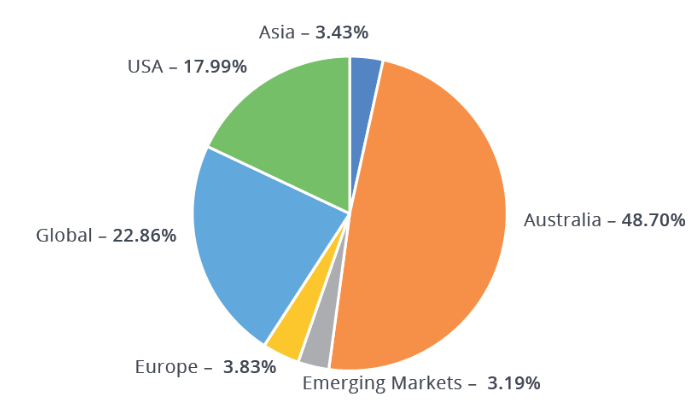
Below the 10 largest ETFs, the level of FUM falls significantly. InvestSMART’s sector analysis shows that half of the ETFs on the ASX have less than $50 million in FUM, and 51 of those have less than $20 million, including 29 that have less than $10 million. Many of the smaller funds are relatively new, and in all likelihood will grow over time.
Figure 8: Australian ETF market breakdown
Market Overview - Flows
By analysing FUM flow, we can see the ‘net demand’ for ETF products. Given the majority of ETFs are index tracking - designed to replicate the performance of a given market index - analysing flows over time offers an insight into trends in market sentiment toward a particular asset class.
Figure 9: FUM Flows
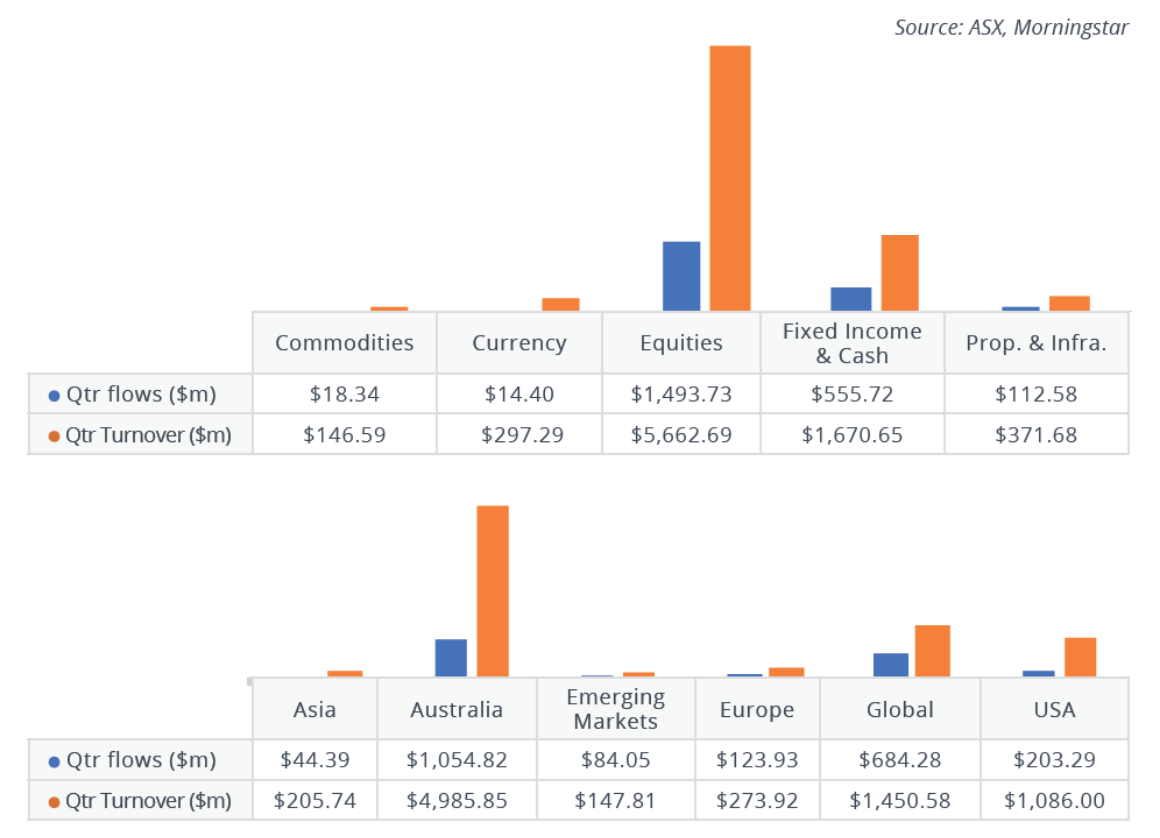
Overview
In the September quarter, equities continued to enjoy most of the inflows, followed by fixed income & cash. We’ve seen this trend month after month since the beginning of the calendar year, with equities dominating in each month except for January.
The ETF with the largest net inflows for the quarter was Vanguard’s Australian Shares ETF (VAS).
The ETF seeing the largest net outflows was SPDRs ASX 200 ETF (STW).
Figure 10: FUM Flows ($m) by Asset Class
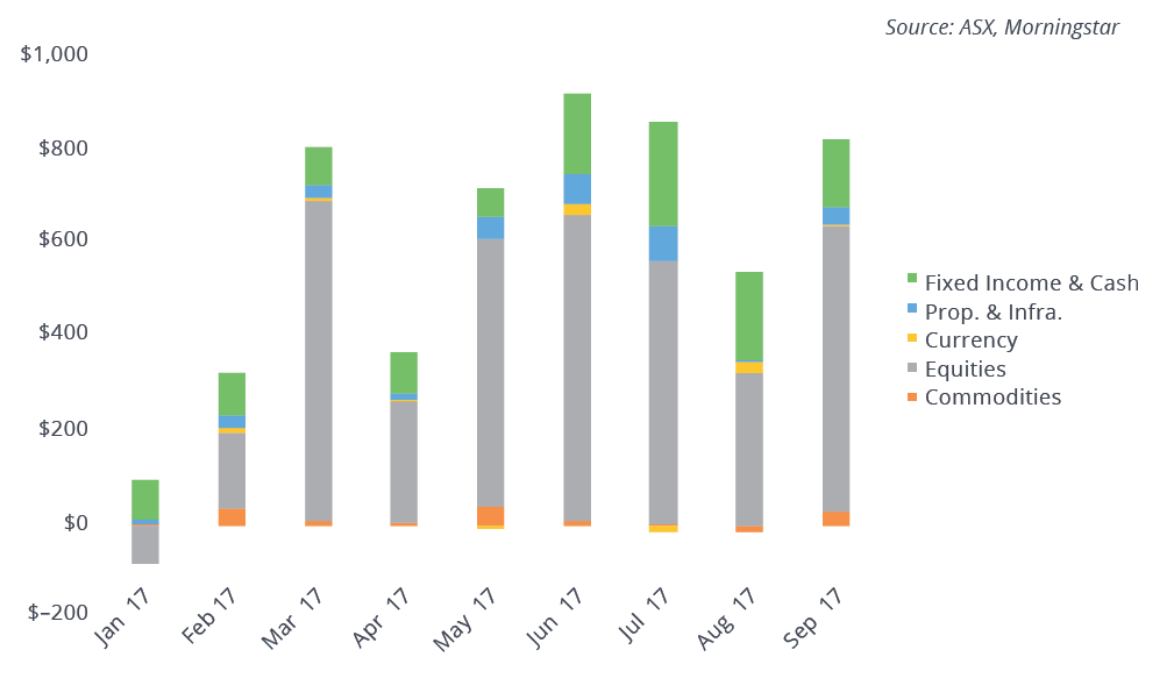
Figure 11: Largest Inflows
| Code | Name | Quarter Flows ($m) |
|---|---|---|
| VAS | Vanguard Australian Shares ETF | 480.66 |
| BILL | iShares Core Cash ETF | 145.70 |
| VGS | Vanguard MSCI Index Intl ETF | 137.27 |
| VHY | Vanguard Australian Shares High Yld ETF | 100.55 |
| QPON | Betashares Aus Bank Sr Fltng Rt Bd ETF | 94.14 |
Source: ASX and Morningstar
Figure 12: Largest outflows
| Code | Name | Quarter Flows ($m) |
|---|---|---|
| STW | SPDR? S&P/ASX 200 ETF | -150.25 |
| HVST | BetaShares Australian Div Harvester(mgd) | -60.38 |
| OZF | SPDR? S&P/ASX 200 Fincls EX A-REIT ETF | -56.88 |
| ZOZI | ETFS S&P/ASX 100 ETF | -21.52 |
| IXI | iShares Global Consumer Staples ETF (AU) | -13.83 |
Source: ASX and Morningstar
Market Overview - Costs
Traditionally, active fund managers have charged a management fee as a percentage of FUM, plus a performance fee based on outperformance compared with a benchmark. As most ETFs are passive (index tracking), management fees are generally lower and there are no performance fees.
It’s also important to factor in the spread when reviewing an ETF. The spread is the difference between the bid and offer price of an ETF, generally a function of the liquidity in the underlying holdings. The management expense ratio (MER), meanwhile, is an indication of all fees and charges, expressed as a percentage of funds under management.
Figure 13: Cost Analysis
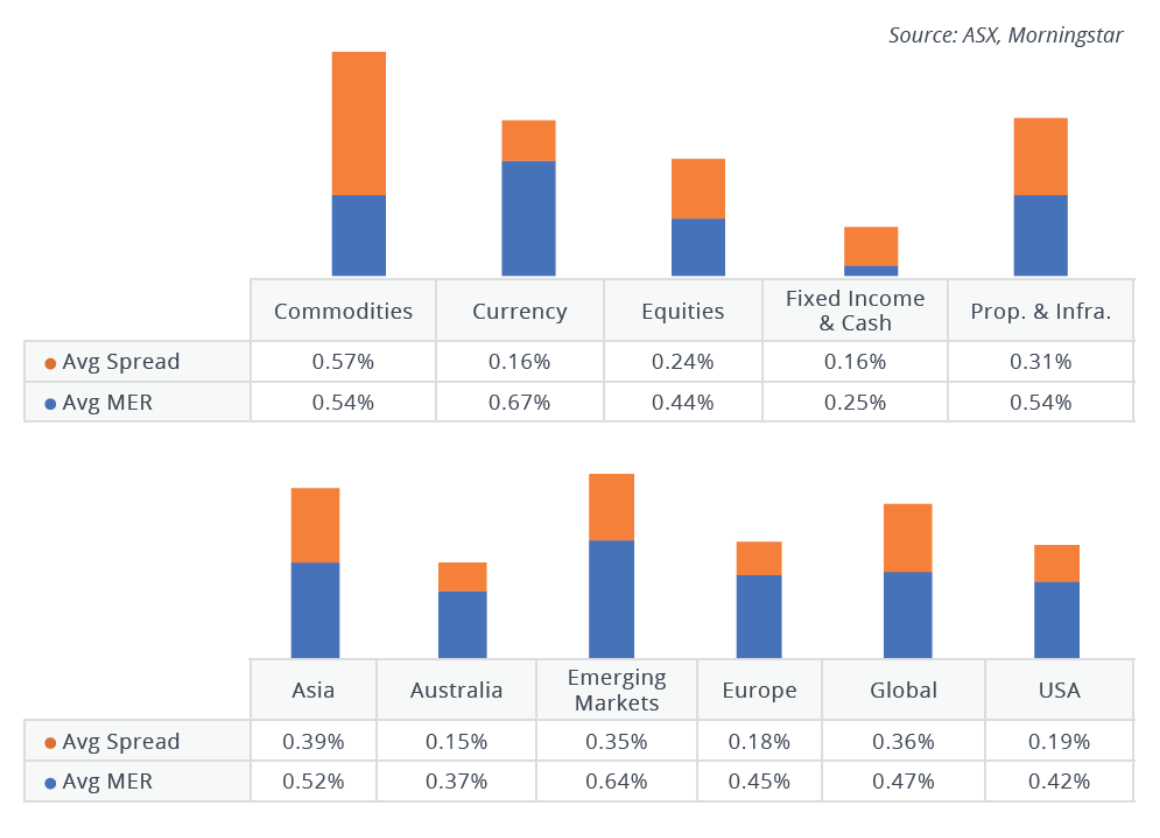
Overview
Fixed income & cash remains the cheapest asset class, even after incorporating spreads. Geographically, ETFs focused on Australia and the US are, on average, the cheapest.
Broad-based equity market and cash-focussed ETFs are the cheapest, a function of the underlying liquidity in these markets.
Actively managed and more complex ETFs tend to be more expensive, a result of generally higher management fees and larger spreads, designed to incorporate the costs of dealing in the fund’s underlying securities.
Figure 15: Five most expensive ETFs
| Code | Name | MER | Spread | Total Costs |
|---|---|---|---|---|
| ETPMPD | ETFS Physical Palladium ETC | 0.49% | 1.41% | 1.90% |
| RENT | AMP Capital Global Property Secs Unhdg | 0.99% | 0.87% | 1.86% |
| QCB | BetaShares Com Basket ETF Ccy Hgd(Synth) | 0.69% | 1.04% | 1.73% |
| QAG | BetaShares Agriculture ETF CcyHgd(Synth) | 0.69% | 0.93% | 1.62% |
| AUDS | BetaShares Strong Australian Dollar Hdg | 1.38% | 0.20% | 1.58% |
Source: ASX and Morningstar
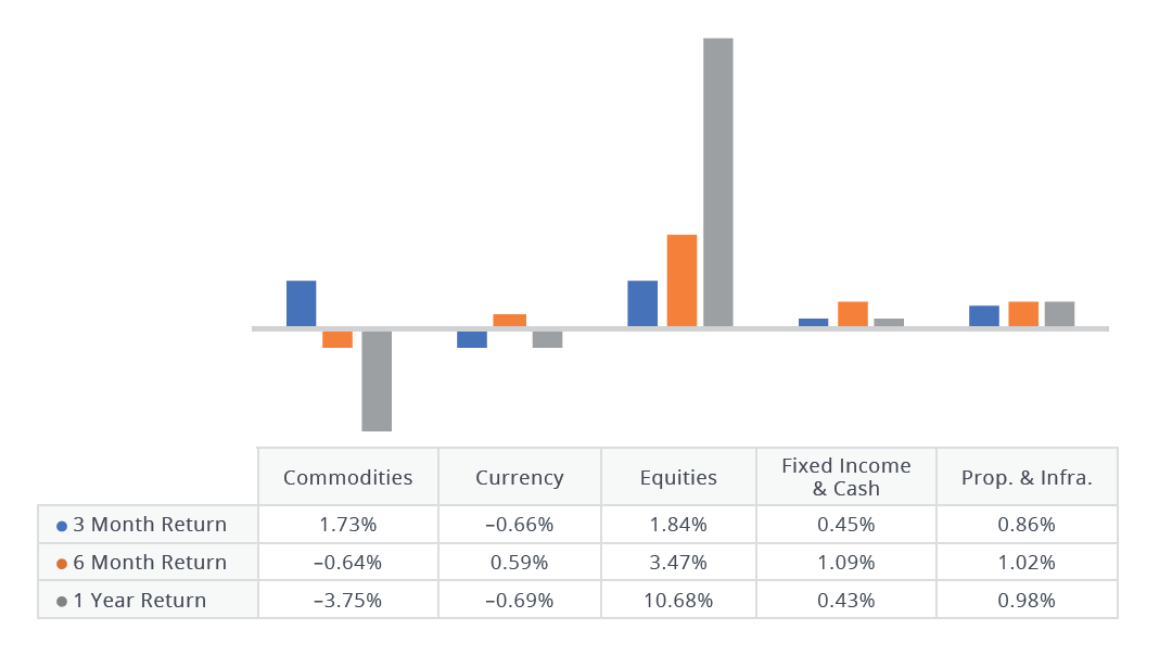
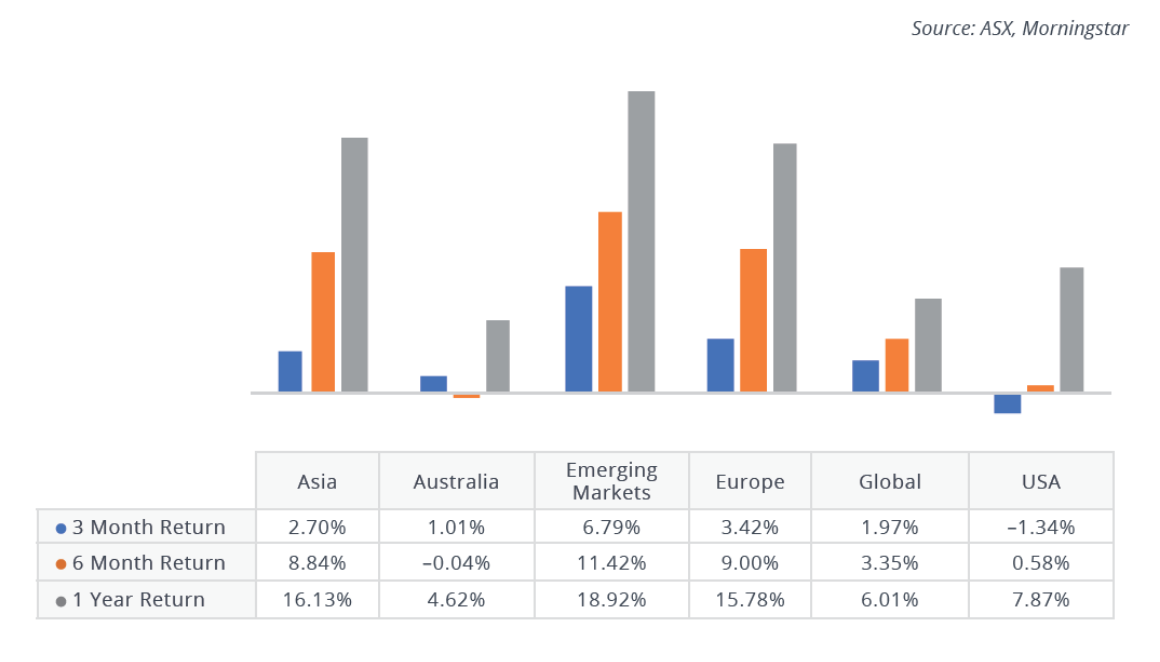
Market Overview - Performance
An ETF should closely track its underlying index. Unlike active fund managers, negative returns do not necessarily mean the fund manager is doing poorly. Instead, it’s a reflection of the performance of the underlying securities the ETF has been designed to track, minus the fee.
Overview
Following weaker performance in previous periods, resource-focused ETFs made up 4 of the top 5 best performing ETFs for the quarter. Geographically, ETFs exposed to emerging markets provided the largest returns over the three months.
Figure 16: Top 5 performing securities
| Code | Name | 3 Month return |
|---|---|---|
| IBK | iShares MSCI BRIC ETF (AU) | 11.06% |
| OOO | BetaShares Crude Oil ETF Ccy Hgd(Synth) | 10.19% |
| MVR | VanEck Vectors Australian Resources ETF | 9.89% |
| OZR | SPDR? S&P/ASX 200 Resources ETF | 9.16% |
| QRE | BetaShares S&P/ASX200 Res Sect ETF | 9.16% |
Source: ASX and Morningstar
Figure 17: Worst 5 performing securities
| Code | Name | 3 Month return |
|---|---|---|
| BBUS | BetaShares US Eqs Strong Bear H-Ccy Hdg | -9.62% |
| QAG | BetaShares Agriculture ETF CcyHgd(Synth) | -7.38% |
| YANK | BetaShares Strong US Dollar Hedge | -6.35% |
| HVST | BetaShares Australian Div Harvester(mgd) | -5.85% |
| IJH | iShares S&P Mid-Cap ETF | -5.29% |
Source: ASX and Morningstar
Figure 18: Top 5 returning ETFs
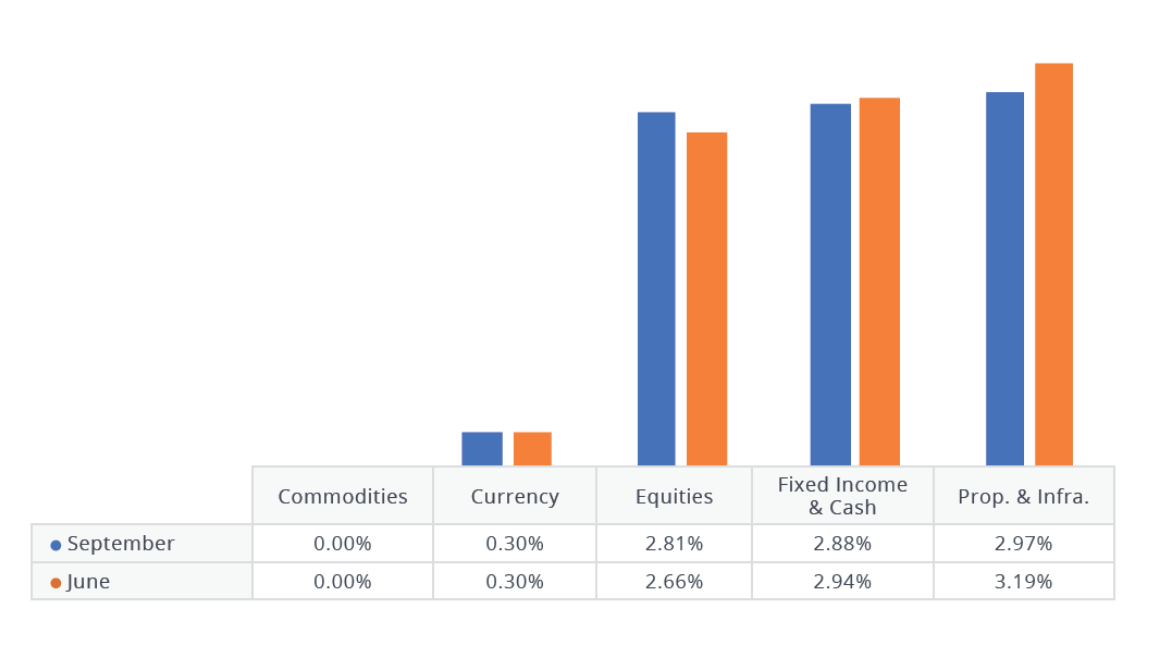
Market Overview - Yield
Yield is the income earned on an investment, expressed as a percentage. Historically, Fixed income, Property & Infrastructure securities have generated most of an investor’s return from distributions of income.
With equities, it’s a bit different as a company can distribute profits or retain them to grow, or a combination of the two. Investments in physical Commodities and Currency meanwhile, offer little or nothing in terms of yield as they’re non-income producing assets.
Figure 19: Average historic yield
| Code | Name | Historic yield |
|---|---|---|
| IHOO | iShares Global 100 AUD Hedged ETF | 11.96% |
| HVST | BetaShares Australian Div Harvester(mgd) | 11.58% |
| VIF | Vanguard Intl Fxd Intr Idx (Hdg) ETF | 9.53% |
| ZYAU | ETFS S&P/ASX 300 High Yield Plus ETF | 9.42% |
| VCF | Vanguard Intl Credit Secs Idx (Hdg) ETF | 9.39% |
Source: ASX and Morningstar
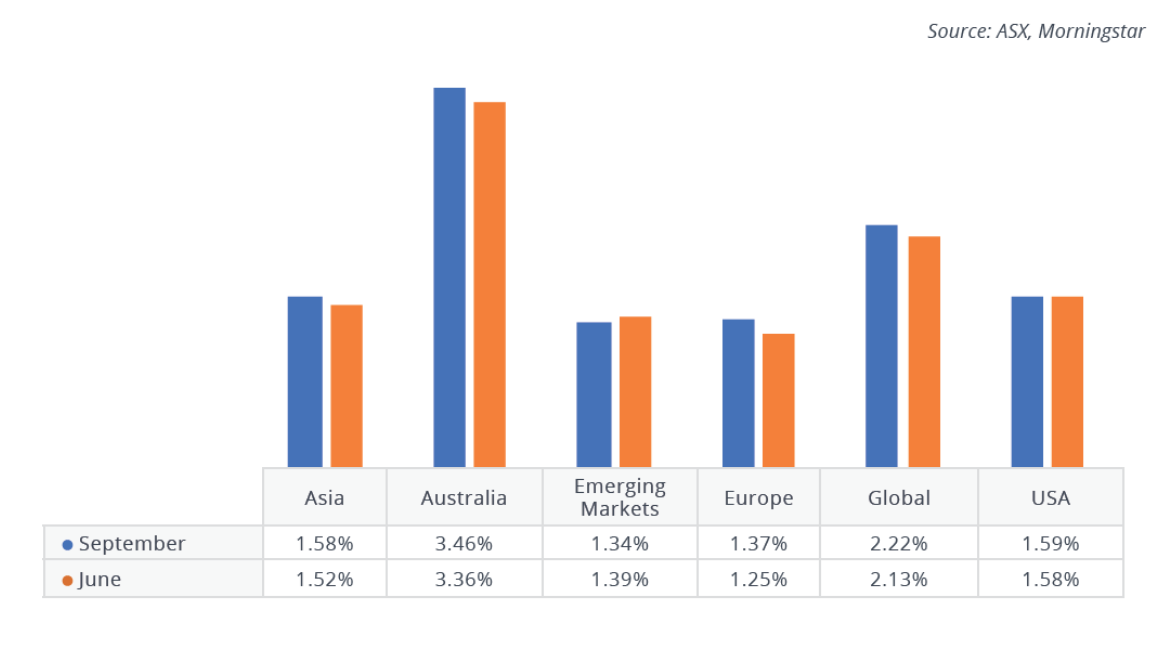
Overview
Equities, Fixed Income & Cash and Property & Infrastructure provided the greatest Income based returns for the 12 months to September.
Geographically, Australia enjoyed the highest returns from income, a function of our high interest rates and equity pay-out ratios compared to the rest of the world.
There is also an increasing number of “high income, low volatility” ETFs coming to market as investors grow wary of global volatility.
The highest yielding security for the year to September was iShares Global 100 AUD Hedged ETF (IHOO). The fund aims to provide investors with the performance of an index composed of 100 large capitalisation global equities (hedged to Australian dollars).
Figure 20: Top 5 Yielding ETFs
Securities Overview - Commodities
Commodities securities are designed to provide exposure to the performance of various commodities and natural resources. The majority are physically backed, although synthetic security listings are rising.
We do not hold any Commodity focused ETFs in our SMA Portfolios.
Figure 21: Commodity ETF Highlights
| FUM ($m) | 735.58 |
| Quarter flows | 18.34 |
| Average Returns - 3 Months | 1.73% |
| Average Returns - 12 Months | -3.75% |
| Average Star Rating | 2.10 |
| Average Historic Yield | 0.00% |
| Average MER | 0.54% |
| Average Spread | 0.57% |
| Quarter Average Liquidity | 8.11% |
Source: ASX and Morningstar
Overview
Close to 100% of net inflows for the quarter were directed to ETF Securities Gold ETF (GOLD).
ETFS Physical Palladium (ETPMPD) was the strongest performer (albeit off a very low level of FUM), while the ETFS Physical Silver (ETPMAG) and ETFS Physical Platinum ETFs (ETPMAG) were the worst performing securities within the category.
Figure 22: Commodity ETFs by Geography
Figure 23: Commodity EFTs
| Name | Code | FUM ($M) | Qtr Flows ($M) | MER | Qtr Avg Spread | 3MTH Return | 12MTH Return | Historical YLD | QTR AVG Liquidity | Daily Vol-QTR AVG | STAR Rating |
|---|---|---|---|---|---|---|---|---|---|---|---|
| GLOBAL | |||||||||||
| Agriculture | |||||||||||
| BetaShares Agriculture ETF CcyHgd(Synth) | QAG | 2.66 | 0.00 | 0.69% | 0.93% | -7.38% | -11.18% | 0.00% | 11.13% | 1,435 | 2 |
| Diversified Commodities | |||||||||||
| ETFS Physical PM Basket ETC | ETPMPM | 4.86 | 0.00 | 0.44% | 0.51% | 1.70% | -4.30% | 0.00% | 1.55% | 21 | 2 |
| BetaShares Com Basket ETF Ccy Hgd(Synth) | QCB | 9.45 | 0.00 | 0.69% | 1.04% | 1.83% | 1.91% | 0.00% | 5.95% | 2,029 | 2 |
| Gold. | |||||||||||
| ETFS Physical Gold ETC | GOLD | 542.10 | 19.96 | 0.40% | 0.09% | 0.87% | -5.76% | 0.00% | 6.93% | 7,859 | 4 |
| BetaShares Gold Bullion ETF Ccy Hedged | QAU | 60.73 | 0.00 | 0.59% | 0.23% | 3.03% | -3.88% | 0.00% | 6.35% | 9,658 | 2 |
| ETFS Physical Singapore Gold ETF | ZGOL | 13.02 | 0.00 | 0.40% | 0.35% | 1.09% | -5.86% | 0.00% | 4.16% | 1,120 | 2 |
| Oil | |||||||||||
| BetaShares Crude Oil ETF Ccy Hgd(Synth) | OOO | 41.79 | -1.82 | 0.69% | 0.16% | 10.19% | -5.02% | 0.00% | 12.54% | 12,415 | 2 |
| Palladium | |||||||||||
| ETFS Physical Palladium ETC | ETPMPD | 1.89 | 0.00 | 0.49% | 1.41% | 8.55% | 25.68% | 0.00% | 2.29% | 13 | 1 |
| Platinum | |||||||||||
| ETFS Physical Platinum ETC | ETPMPT | 2.94 | 0.00 | 0.49% | 0.45% | -2.58% | -13.65% | 0.00% | 2.59% | 22 | 2 |
| Silver | |||||||||||
| ETFS Physical Silver ETC | ETPMAG | 56.14 | 0.20 | 0.49% | 0.53% | -0.05% | -15.44% | 0.00% | 3.62% | 3,292 | 2 |
Source: ASX and Morningstar
Securities Overview - Currency
These securities are designed to track the performance of the Australian dollar relative to various currencies.
We do not hold any Currency focussed ETFs in our SMA Portfolios.
Figure 24: Currency ETF Highlights
| FUM ($m) | 591.83 |
| Quarter flows | 14.40 |
| Average Returns - 3 Months | -0.66% |
| Average Returns - 12 Months | -0.69% |
| Average Star Rating | 2.86 |
| Average Historic Yield | 0.30% |
| Average MER | 0.67% |
| Average Spread | 0.16% |
| Quarter Average Liquidity | 12.61% |
Source: ASX and Morningstar
Overview
The majority on inflows were directed to the BetaShares Strong USD ETF (YANK). The stronger $A relative to the $US saw Betashares Strong Australian Dollar ETF (AUDS) perform well.
AUDS provides investors with a way to obtain magnified “long” exposure to the value of Australian dollar relative to the US dollar.
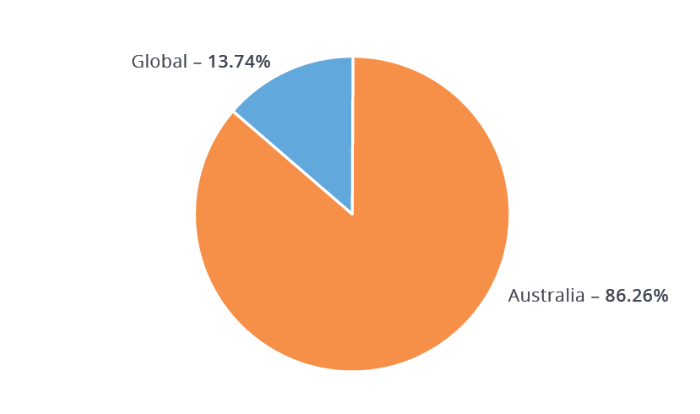
Figure 25: Currency ETFs by Geography
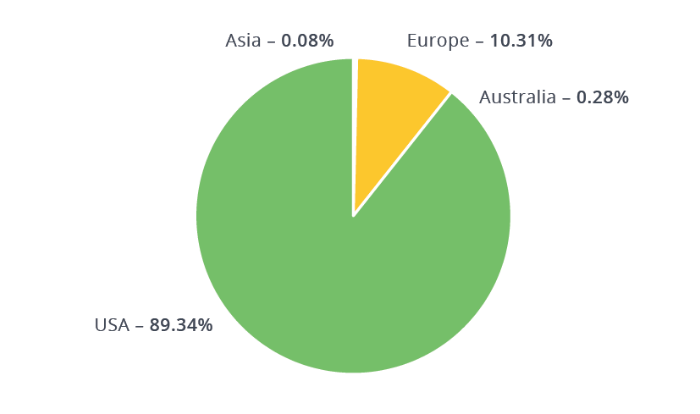
Figure 26: Currency EFTs
| Name | Code | FUM ($M) | Qtr Flows ($M) | MER | Qtr Avg Spread | 3MTH Return | 12MTH Return | Historical YLD | QTR AVG Liquidity | Daily Vol-QTR AVG | STAR Rating |
|---|---|---|---|---|---|---|---|---|---|---|---|
| ASIA | |||||||||||
| ETFS Physical Renminbi ETF | ZCNH | 0.45 | 0.00 | 0.30% | 0.26% | -0.36% | -2.38% | 0.00% | 1.50% | 25 | 2 |
| EUROPE | |||||||||||
| BetaShares Euro ETF | EEU | 5.69 | 1.10 | 0.45% | 0.12% | 1.20% | 2.11% | 0.00% | 22.10% | 2,448 | 3 |
| BetaShares British Pound ETF | POU | 55.30 | 0.00 | 0.45% | 0.09% | 0.88% | 0.36% | 0.00% | 12.22% | 13,342 | 3 |
| AUSTRALIA | |||||||||||
| BetaShares Strong Australian Dollar Hdg | AUDS | 1.65 | 0.03 | 1.38% | 0.20% | 4.30% | 0.00% | 1.90% | 49.70% | 1,827 | 2 |
| USA | |||||||||||
| BetaShares US Dollar ETF | USD | 503.73 | 4.85 | 0.45% | 0.09% | -2.21% | -2.57% | 0.17% | 17.32% | 228,031 | 5 |
| BetaShares Strong US Dollar Hedge | YANK | 13.01 | 7.65 | 1.38% | 0.17% | -6.35% | 0.00% | 0.00% | 50.03% | 13,503 | 2 |
| ETFS Physical US Dollar ETF | ZUSD | 11.99 | 0.77 | 0.30% | 0.16% | -2.11% | -2.36% | 0.00% | 6.66% | 2,631 | 3 |
Source: ASX and Morningstar
Securities Overview - Property & Infrastructure
These securities are designed to track various Domestic and Global Property & Infrastructure indexes.
We hold positions in VAP, IFRA & DJRE in our SMA Portfolios.
Figure 27: Property & Infrastructure ETF Highlights
| FUM ($m) | 1,851.84 |
| Quarter flows | 112.58 |
| Average Returns - 3 Months | 0.86% |
| Average Returns - 12 Months | 0.98% |
| Average Star Rating | 2.25 |
| Average Historic Yield | 2.97% |
| Average MER | 0.54% |
| Average Spread | 0.31% |
| Quarter Average Liquidity | 19.90% |
Source: ASX and Morningstar
Overview
VanEck’s Vectors Australian Property ETF (MVA) was the best performing for the quarter, while the Dow Jones Global Real Estate ETF (DJRE) was the worst. Despite negative returns, VAP saw the largest inflows during the quarter.
Figure 28: Property & Infrastructure ETFs by Geography
Invest in the InvestSMART Property and Infrastructure Portfolio
Figure 29: Property & Infrastructure EFTs
| Name | Code | FUM ($M) | Qtr Flows ($M) | MER | Qtr Avg Spread | 3MTH Return | 12MTH Return | Historical YLD | QTR AVG Liquidity | Daily Vol-QTR AVG | STAR Rating |
|---|---|---|---|---|---|---|---|---|---|---|---|
| AUSTRALIA | |||||||||||
| Property | |||||||||||
| VanEck Vectors Australian Property ETF | MVA | 69.93 | 9.64 | 0.35% | 0.17% | 2.68% | 0.24% | 5.55% | 7.56% | 8,406 | 3 |
| SPDR? S&P/ASX 200 Listed Property ETF | SLF | 565.80 | 3.66 | 0.40% | 0.18% | 1.61% | -2.86% | 4.34% | 3.25% | 49,722 | 3 |
| Vanguard Australian Property Secs ETF | VAP | 961.68 | 59.60 | 0.23% | 0.10% | 1.98% | -1.81% | 4.06% | 7.88% | 32,275 | 3 |
| GLOBAL | |||||||||||
| Infrastructure | |||||||||||
| AMP Capital Global Infras Secs Unhdg | GLIN | 24.52 | 1.98 | 0.85% | 0.72% | 1.84% | 7.15% | 2.13% | 19.37% | 59,068 | 2 |
| VanEck Vectors FTSE Glbl Infras(Hdg)ETF | IFRA | 49.39 | 11.85 | 0.52% | 0.27% | 1.11% | 11.03% | 2.55% | 14.01% | 10,316 | 2 |
| ETFS Global Core Infrastructure ETF | CORE | 0.77 | 0.77 | 0.45% | 0.00% | 0.00% | 0.00% | 29.99% | 0 |
||
| Property | |||||||||||
| SPDR? Dow Jones Global Real Estate ETF | DJRE | 162.73 | 21.97 | 0.50% | 0.15% | -1.60% | -3.61% | 3.56% | 6.99% | 18,368 | 3 |
| AMP Capital Global Property Secs Unhdg | RENT | 17.04 | 3.11 | 0.99% | 0.87% | -0.73% | -2.31% | 1.55% | 25.49% | 63,092 | 2 |
Source: ASX and Morningstar
Securities Overview - Fixed Income & Cash
These securities are designed to provide investors access to domestic and global Fixed Income & Cash securities.
We hold positions in AAA, FLOT & IAF in our SMA Portfolios.
Figure 30: Fixed Income & Cash ETF Highlights
| FUM ($m) | 3,804.16 |
| Quarter flows | 555.72 |
| Average Returns - 3 Months | 0.45% |
| Average Returns - 12 Months | 0.43% |
| Average Star Rating | 3.30 |
| Average Historic Yield | 2.88% |
| Average MER | 0.25% |
| Average Spread | 0.16% |
| Quarter Average Liquidity | 10.03% |
Source: ASX and Morningstar
Overview
The iShares JP Morgan USD Emerging Markets Bond (AUD Hedged) ETF was the best performing Fixed Income & Cash ETF for the quarter while iShares Government Inflation ETF (ILB) was the worst.
iShares’ new Core Cash ETF (BILL), a lower-cost alternative to the longer standing BetaShares High Interest Cash ETF (AAA), enjoyed the largest inflows for the quarter.
Figure 31: Fixed Income ETFs by Geography
Invest in the InvestSMART Interest Income Portfolio
Figure 32: Fixed Income & CASH EFTs
| Name | Code | FUM ($M) | Qtr Flows ($M) | MER | Qtr Avg Spread | 3MTH Return | 12MTH Return | Historical YLD | QTR AVG Liquidity | Daily Vol-QTR AVG | STAR Rating |
|---|---|---|---|---|---|---|---|---|---|---|---|
| GLOBAL | |||||||||||
| Corporate | |||||||||||
| iShares Core Global Corp Bd AUDH ETF | IHCB | 79.12 | 10.68 | 0.26% | 0.26% | 1.06% | 2.01% | 2.90% | 8.39% | 1,999 | 3 |
| iShares Global High Yield Bond AUDH ETF | IHHY | 26.17 | 7.63 | 0.56% | 0.34% | 1.77% | 8.42% | 4.70% | 17.03% | 1,231 | 2 |
| Diversified | |||||||||||
| iShares JP Morgan USD EmMkts Bd AUDH ETF | IHEB | 10.89 | 3.25 | 0.51% | 0.38% | 2.73% | 4.42% | 4.40% | 19.66% | 596 | 2 |
| Vanguard Intl Credit Secs Idx (Hdg) ETF | VCF | 125.34 | 25.81 | 0.30% | 0.16% | 1.11% | 1.81% | 9.39% | 9.33% | 7,345 | 3 |
| Government | |||||||||||
| Vanguard Intl Fxd Intr Idx (Hdg) ETF | VIF | 152.14 | 50.30 | 0.20% | 0.09% | 0.62% | -0.79% | 9.53% | 14.56% | 13,594 | 4 |
| AUSTRALIA | |||||||||||
| Cash | |||||||||||
| BetaShares Aus High Interest Cash ETF | AAA | 1,263.54 | 17.45 | 0.18% | 0.02% | 0.50% | 2.03% | 2.00% | 21.86% | 178,369 | 5 |
| iShares Core Cash ETF | BILL | 155.83 | 145.70 | 0.07% | 0.01% | 0.44% | 0.00% | 0.32% | 39.15% | 17,911 | 4 |
| iShares Enhanced Cash ETF | ISEC | 15.05 | 10.02 | 0.12% | 0.01% | 0.54% | 0.00% | 0.40% | 38.25% | 1,698 | 4 |
| UBS IQ Cash ETF | MONY | 1.00 | 0.00 | 0.18% | 0.05% | 0.41% | 0.00% | 0.56% | 0.67% | 11 | 3 |
| Corporate | |||||||||||
| VanEck Vectors Australian Corp Bd ETF | PLUS | 80.62 | 43.99 | 0.32% | 0.26% | 0.79% | 0.00% | 0.94% | 25.31% | 31,770 | 3 |
| Russell Inv Australian Select CorpBd ETF | RCB | 147.66 | 15.23 | 0.28% | 0.25% | 1.52% | 2.99% | 4.23% | 6.87% | 16,560 | 3 |
| Vanguard Australian Corp Fxd Intr ETF | VACF | 62.08 | 25.01 | 0.26% | 0.19% | 0.71% | 2.01% | 2.96% | 17.88% | 6,301 | 3 |
| VanEck Vectors Australian Fltng Rt ETF | FLOT | 21.19 | 21.15 | 0.22% | 0.06% | 0.00% | 0.00% | 0.67% | 46.19% | 8,086 | 3 |
| Betashares Aus Bank Sr Fltng Rt Bd ETF | QPON | 110.59 | 94.14 | 0.22% | 0.04% | 0.98% | 0.00% | 0.76% | 46.82% | 42,881 | 4 |
| Diversified | |||||||||||
| iShares Core Composite Bond ETF | IAF | 453.07 | 36.65 | 0.20% | 0.06% | -0.12% | -0.93% | 2.21% | 8.10% | 11,349 | 4 |
| Vanguard Australian Fixed Interest ETF | VAF | 676.10 | 36.79 | 0.20% | 0.06% | -0.11% | -0.89% | 2.81% | 7.14% | 32,562 | 4 |
| Government | |||||||||||
| SPDR? S&P/ASX Australian Bond ETF | BOND | 28.29 | 0.03 | 0.24% | 0.15% | -0.61% | -1.27% | 3.15% | 5.64% | 2,087 | 3 |
| SPDR? S&P/ASX Australian Govt Bd ETF | GOVT | 15.33 | 0.01 | 0.22% | 0.11% | -0.82% | -1.94% | 2.53% | 7.41% | 1,486 | 3 |
| iShares Treasury ETF | IGB | 29.34 | 0.01 | 0.26% | 0.18% | -0.49% | -2.85% | 2.70% | 8.54% | 816 | 3 |
| iShares Government Inflation ETF | ILB | 94.90 | 6.86 | 0.26% | 0.35% | -0.85% | -1.73% | 0.90% | 8.45% | 2,320 | 3 |
| Russell Inv Australian Government Bd ETF | RGB | 59.47 | 0.02 | 0.24% | 0.30% | -0.08% | -2.36% | 3.25% | 1.25% | 1,191 | 3 |
| Russell Inv Australian Semi-Govt Bd ETF | RSM | 60.58 | 0.04 | 0.26% | 0.28% | 0.66% | 0.58% | 2.33% | 3.34% | 3,316 | 3 |
| Vanguard Australian Government Bond ETF | VGB | 135.85 | 4.98 | 0.20% | 0.09% | -0.33% | -1.67% | 2.58% | 8.74% | 8,004 | 4 |
Source: ASX and Morningstar
Securities Overview - Equities
Offering broad-based and specific sector exposure to domestic and international equity markets, there are an increasing number of ETFs designed to achieve specific rules-based objectives. Examples include high yield, ethical, value and momentum.
We hold positions in IAA, IVV, VEQ, VE, UMAX & IOZ our SMA Portfolios.
Figure 33: Equity ETF Highlights
| FUM ($m) | 23,407.08 |
| Quarter flows | 1,493.73 |
| Average Returns - 3 Months | 1.84% |
| Average Returns - 12 Months | 10.68% |
| Average Star Rating | 2.72 |
| Average Historic Yield | 2.81% |
| Average MER | 0.44% |
| Average Spread | 0.24% |
| Quarter Average Liquidity | 13.96% |
Source: ASX and Morningstar
Overview
ETFs focused on emerging markets were the best performing category for the quarter.
The Vanguard Australian Shares ETF (VAS) saw the largest inflows for the quarter, while the SPDR S&P/ASX 200 ETF (STW) saw the largest outflows. These are the largest ETFs on the Australian market, holding more than $6.7 billion in FUM.
Figure 34: Equity ETFs by Geography
Invest in the InvestSMART International Equities Portfolio
Figure 35: Australian Equity EFTs
| Name | Code | FUM ($M) | Qtr Flows ($M) | MER | Qtr Avg Spread | 3MTH Return | 12MTH Return | Historical YLD | QTR AVG Liquidity | Daily Vol-QTR AVG | STAR Rating |
|---|---|---|---|---|---|---|---|---|---|---|---|
| AUSTRALIA | |||||||||||
| Equities - Broad | |||||||||||
| BetaShares Aus Ex-20 Port Divrs ETF | EX20 | 12.84 | 1.61 | 0.25% | 0.12% | 1.08% | 0.00% | 1.70% | 13.31% | 3,253 | 3 |
| iShares S&P/ASX 20 ETF | ILC | 318.73 | 5.33 | 0.24% | 0.07% | 0.31% | 8.87% | 4.88% | 4.99% | 22,762 | 4 |
| iShares Core S&P/ASX 200 ETF | IOZ | 723.16 | 46.45 | 0.15% | 0.07% | 0.64% | 9.08% | 3.93% | 8.59% | 84,956 | 4 |
| iShares S&P/ASX Small Ordinaries ETF | ISO | 64.54 | 1.36 | 0.55% | 0.33% | 4.22% | 2.56% | 2.39% | 5.46% | 26,522 | 3 |
| VanEck Vectors S&P/ASX MidCap ETF | MVE | 48.36 | 15.00 | 0.45% | 0.17% | -0.79% | 9.18% | 2.24% | 13.72% | 8,001 | 2 |
| VanEck Vectors Small Coms Masters ETF | MVS | 60.95 | 4.32 | 0.49% | 0.18% | 0.83% | 2.38% | 3.27% | 6.26% | 6,902 | 3 |
| VanEck Vectors Australian Equal Wt ETF | MVW | 316.65 | 52.01 | 0.35% | 0.09% | 0.43% | 8.97% | 2.75% | 11.30% | 42,888 | 4 |
| BetaShares FTSE RAFI Australia 200 ETF | QOZ | 270.03 | 25.40 | 0.40% | 0.11% | 1.81% | 12.36% | 3.31% | 10.50% | 71,762 | 4 |
| SPDR? S&P/ASX 50 ETF | SFY | 443.34 | 16.81 | 0.29% | 0.06% | 0.50% | 9.40% | 4.90% | 4.61% | 12,805 | 4 |
| SPDR? S&P/ASX Small Ordinaries ETF | SSO | 14.60 | 2.62 | 0.50% | 0.20% | 4.26% | 3.08% | 2.63% | 6.64% | 2,298 | 2 |
| SPDR? S&P/ASX 200 ETF | STW | 3,300.20 | -150.25 | 0.19% | 0.04% | 0.63% | 9.06% | 4.42% | 9.01% | 188,674 | 5 |
| Vanguard Australian Shares ETF | VAS | 2,429.80 | 480.66 | 0.14% | 0.05% | 0.81% | 8.91% | 4.13% | 10.30% | 104,961 | 5 |
| Vanguard MSCI Australian Large Coms ETF | VLC | 73.71 | 2.42 | 0.20% | 0.05% | 0.51% | 8.13% | 4.51% | 5.88% | 2,365 | 3 |
| Vanguard MSCI Australian Small Coms ETF | VSO | 105.52 | 11.17 | 0.30% | 0.12% | 2.08% | 5.06% | 4.32% | 8.61% | 5,957 | 3 |
| ETFS S&P/ASX 100 ETF | ZOZI | 10.19 | -21.52 | 0.24% | 0.20% | 0.37% | 9.39% | 4.67% | 101.01% | 31,183 | 2 |
| Equities - Sector | |||||||||||
| VanEck Vectors Australian Banks ETF | MVB | 27.26 | 0.06 | 0.28% | 0.09% | 2.35% | 15.00% | 5.39% | 15.40% | 5,133 | 3 |
| VanEck Vectors Australian Resources ETF | MVR | 28.47 | 0.01 | 0.35% | 0.11% | 9.89% | 21.67% | 1.90% | 5.92% | 2,596 | 3 |
| SPDR? S&P/ASX 200 Fincls EX A-REIT ETF | OZF | 62.49 | -56.88 | 0.40% | 0.11% | 0.05% | 13.69% | 4.95% | 42.84% | 7,557 | 3 |
| SPDR? S&P/ASX 200 Resources ETF | OZR | 39.91 | 6.20 | 0.40% | 0.17% | 9.16% | 17.95% | 1.86% | 9.29% | 13,197 | 2 |
| BetaShares S&P/ASX200 Fincls Sect ETF | QFN | 17.82 | -9.31 | 0.39% | 0.13% | 0.04% | 13.59% | 5.20% | 36.19% | 18,866 | 3 |
| BetaShares S&P/ASX200 Res Sect ETF | QRE | 17.74 | 0.01 | 0.39% | 0.28% | 9.16% | 17.88% | 1.52% | 8.26% | 10,201 | 2 |
| Equities - Strategy | |||||||||||
| iShares Edge MSCI Australia Multifactor | AUMF | 6.45 | 0.00 | 0.30% | 0.21% | 2.12% | 0.00% | 1.96% | 6.72% | 536 | 3 |
| BetaShares Managed Risk Australian Share | AUST | 30.94 | 0.01 | 0.49% | 0.11% | 0.21% | 5.07% | 3.34% | 7.13% | 4,758 | 3 |
| BetaShares Australian Eqs Strong BearHdg | BBOZ | 96.68 | -7.07 | 1.38% | 0.11% | -1.33% | -17.65% | 0.00% | 64.56% | 117,071 | 3 |
| BetaShares Aus Equities Bear Hedge | BEAR | 55.39 | -7.49 | 1.38% | 0.11% | -0.49% | -7.28% | 0.00% | 14.98% | 18,861 | 3 |
| UBS IQ Morningstar Australia Div Yld ETF | DIV | 27.90 | 1.16 | 0.30% | 0.25% | -1.23% | 6.93% | 4.70% | 3.02% | 1,379 | 2 |
| UBS IQ Morningstar Australia Quality ETF | ETF | 27.15 | 0.15 | 0.30% | 0.19% | -1.87% | 1.50% | 1.64% | 3.51% | 1,583 | 3 |
| VanEck Vectors S&P/ASX Franked Div ETF | FDIV | 3.73 | 0.00 | 0.35% | 0.20% | -0.15% | -0.18% | 4.34% | 9.73% | 519 | 2 |
| BetaShares Geared Australian Equity(Hdg) | GEAR | 64.63 | 2.50 | 0.80% | 0.11% | 0.35% | 16.27% | 6.53% | 65.81% | 66,811 | 3 |
| iShares S&P/ASX Dividend Opps ETF | IHD | 251.93 | 8.42 | 0.30% | 0.13% | -0.70% | 8.21% | 5.56% | 4.26% | 25,815 | 4 |
| iShares Edge MSCI Australia Minimum Vol | MVOL | 6.29 | 0.00 | 0.30% | 0.20% | -0.96% | 0.00% | 2.21% | 1.44% | 114 | 3 |
| Russell Inv Australian Rspnb Inv ETF | RARI | 66.36 | 1.36 | 0.45% | 0.25% | 0.52% | 8.96% | 5.23% | 3.65% | 3,339 | 3 |
| Russell Inv High Dividend Aus Shrs ETF | RDV | 274.52 | 5.26 | 0.34% | 0.08% | 3.05% | 12.56% | 5.82% | 4.30% | 13,217 | 4 |
| Russell Inv Australian Value ETF | RVL | 13.37 | 0.01 | 0.34% | 0.08% | 0.24% | 10.81% | 4.43% | 4.56% | 681 | 3 |
| BetaShares Australian Small Coms Sel | SMLL | 11.18 | 1.87 | 0.39% | 0.58% | 1.61% | 0.00% | 0.00% | 7.11% | 8,089 | 2 |
| SPDR? MSCI Australia Sel Hi Div Yld ETF | SYI | 186.25 | 8.79 | 0.35% | 0.07% | 0.01% | 10.92% | 5.02% | 4.63% | 9,841 | 3 |
| UBS IQ MSCI Australia Ethical ETF | UBA | 170.60 | 9.82 | 0.17% | 0.14% | 0.80% | 10.26% | 4.08% | 2.31% | 6,803 | 3 |
| Vanguard Australian Shares High Yld ETF | VHY | 938.35 | 100.55 | 0.25% | 0.06% | 1.17% | 12.75% | 7.60% | 7.22% | 35,642 | 4 |
| BetaShares Aus Top 20 Eq Yld Maxmsr | YMAX | 406.15 | 16.49 | 0.79% | 0.16% | 0.73% | 7.05% | 8.81% | 6.53% | 96,797 | 4 |
| ETFS S&P/ASX 300 High Yield Plus ETF | ZYAU | 28.81 | 8.89 | 0.35% | 0.20% | 3.13% | 15.27% | 9.42% | 14.51% | 11,284 | 2 |
| BetaShares Australian Div Harvester(mgd) | HVST | 346.67 | -60.38 | 0.90% | 0.09% | -5.85% | -6.08% | 11.58% | 11.37% | 81,430 | 4 |
Source: ASX and Morningstar
Figure 36: Global Equity EFTs
| Name | Code | FUM ($M) | Qtr Flows ($M) | MER | Qtr Avg Spread | 3MTH Return | 12MTH Return | Historical YLD | QTR AVG Liquidity | Daily Vol-QTR AVG | STAR Rating |
|---|---|---|---|---|---|---|---|---|---|---|---|
| GLOBAL | |||||||||||
| Equities - Broad | |||||||||||
| iShares Global 100 AUD Hedged ETF | IHOO | 29.48 | 2.55 | 0.43% | 0.50% | 4.57% | 21.28% | 11.96% | 9.20% | 824 | 2 |
| iShares Core MSCI World All Cap AUD Hdg | IHWL | 7.44 | 2.43 | 0.19% | 0.62% | 4.33% | 19.83% | 1.14% | 30.60% | 2,284 | 2 |
| iShares Global 100 ETF (AU) | IOO | 1,242.29 | 52.27 | 0.40% | 0.20% | 2.63% | 17.58% | 2.13% | 3.55% | 12,967 | 3 |
| iShares MSCI EAFE ETF (AU) | IVE | 291.34 | 20.95 | 0.33% | 0.30% | 2.98% | 16.00% | 2.13% | 3.99% | 4,347 | 3 |
| iShares Core MSCI World All Cap | IWLD | 14.23 | 4.63 | 0.16% | 0.60% | 2.66% | 15.49% | 1.51% | 14.01% | 1,999 | 2 |
| VanEck Vectors MSCI Wld ex Aus Qlty ETF | QUAL | 265.37 | 38.96 | 0.40% | 0.18% | 2.14% | 13.79% | 3.14% | 9.01% | 37,657 | 3 |
| UBS IQ MSCI World ex Australia Ethcl ETF | UBW | 22.71 | 2.77 | 0.35% | 0.24% | 2.57% | 15.22% | 1.89% | 6.73% | 2,270 | 2 |
| Vanguard All-World ex-US Shares ETF | VEU | 985.66 | 92.20 | 0.11% | 0.13% | -1.92% | 12.55% | 2.26% | 5.03% | 24,095 | 4 |
| Vanguard MSCI Index Intl (Hdg) ETF | VGAD | 308.53 | 61.64 | 0.21% | 0.06% | 4.25% | 19.57% | 4.13% | 12.27% | 19,265 | 3 |
| Vanguard MSCI Index Intl ETF | VGS | 681.75 | 137.27 | 0.18% | 0.07% | 2.53% | 15.44% | 2.96% | 13.64% | 46,499 | 4 |
| SPDR? S&P World ex Australia(Hedged) ETF | WXHG | 71.55 | -10.15 | 0.35% | 0.22% | 4.22% | 19.85% | 3.01% | 14.70% | 15,784 | 2 |
| SPDR? S&P World ex Australia ETF | WXOZ | 152.44 | -3.55 | 0.30% | 0.19% | 2.44% | 15.45% | 2.32% | 2.05% | 3,805 | 3 |
| Equities - Sector | |||||||||||
| BetaShares Glb Banks ETF-Ccy Hdg | BNKS | 55.64 | 13.79 | 0.57% | 0.26% | 5.01% | 38.15% | 1.50% | 17.85% | 43,915 | 2 |
| BetaShares Glb Healthcare ETF-Ccy Hdg | DRUG | 21.92 | 3.29 | 0.57% | 0.31% | 3.13% | 13.71% | 0.00% | 11.50% | 14,154 | 2 |
| BetaShares Global Sstnbty Ldrs ETF | ETHI | 91.73 | 29.47 | 0.59% | 0.23% | 2.96% | 0.00% | 1.21% | 18.41% | 77,847 | 3 |
| BetaShares Glb Agltr Coms ETF-Ccy Hdg | FOOD | 12.82 | 3.43 | 0.57% | 0.32% | 5.86% | 17.98% | 0.95% | 9.86% | 6,759 | 2 |
| BetaShares Glb Energy Coms ETF-Ccy Hdg | FUEL | 6.79 | 1.13 | 0.57% | 0.30% | 8.83% | 6.90% | 4.07% | 16.25% | 6,073 | 2 |
| Market Vectors Gold Miners ETF | GDX | 61.66 | 2.18 | 0.53% | 0.35% | 1.87% | -14.88% | 0.21% | 7.60% | 5,255 | 2 |
| Betashares Global Cybersecurity ETF | HACK | 44.47 | 19.12 | 0.67% | 0.27% | -0.74% | 7.80% | 2.65% | 39.53% | 88,621 | 3 |
| iShares Global Consumer Staples ETF (AU) | IXI | 129.63 | -13.83 | 0.47% | 0.32% | -2.52% | 2.16% | 1.89% | 4.59% | 1,559 | 3 |
| iShares Global Healthcare ETF (AU) | IXJ | 479.18 | 14.30 | 0.47% | 0.26% | 0.61% | 10.43% | 1.34% | 3.08% | 3,433 | 3 |
| iShares Global Telecom ETF (AU) | IXP | 20.05 | -0.38 | 0.47% | 0.51% | 1.09% | -0.95% | 3.38% | 4.75% | 421 | 2 |
| BetaShares Glb Gold Miners ETF-Ccy Hdg | MNRS | 5.32 | 0.00 | 0.57% | 0.50% | 0.24% | -17.61% | 0.44% | 22.38% | 10,533 | 1 |
| ETFS ROBO Glbl Robotics and Atmtn ETF | ROBO | 4.15 | 4.15 | 0.69% | 0.00% | 0.00% | 0.00% | 85.59% | 0 |
||
| Equities - Strategy | |||||||||||
| AMP Capital Dynamic Markets ETF (Hedge) | DMKT | 19.58 | 2.06 | 0.50% | 0.71% | 2.45% | 8.22% | 4.77% | 5.87% | 14,467 | 2 |
| Schroder Real Return ETF | GROW | 41.90 | 6.27 | 0.90% | 0.47% | 0.51% | 4.24% | 1.41% | 6.75% | 25,041 | 3 |
| Market Vectors Morningstar Wide Moat ETF | MOAT | 48.06 | 4.78 | 0.49% | 0.26% | -0.27% | 16.93% | 0.90% | 9.45% | 2,856 | 2 |
| SPDR? MSCI World Quality Mix | QMIX | 6.81 | 0.88 | 0.40% | 0.27% | 2.44% | 11.52% | 2.47% | 4.63% | 602 | 2 |
| ETFS Morningstar Global Technology ETF | TECH | 14.51 | 6.55 | 0.45% | 0.23% | 5.73% | 0.00% | 0.78% | 19.61% | 1,415 | 3 |
| SPDR? S&P Global Dividend ETF | WDIV | 142.24 | 22.70 | 0.50% | 0.23% | 0.89% | 7.98% | 3.97% | 7.32% | 18,306 | 3 |
| iShares Edge MSCI World Multifactor | WDMF | 17.23 | 4.62 | 0.35% | 0.46% | 4.52% | 0.00% | 3.95% | 31.51% | 5,236 | 2 |
| BetaShares Managed Risk Global Share | WRLD | 41.92 | 2.14 | 0.54% | 0.21% | 1.92% | 13.23% | 0.89% | 11.22% | 14,165 | 2 |
| iShares Edge MSCI World Minimum Volatil | WVOL | 11.72 | 0.00 | 0.30% | 0.49% | 1.14% | 0.00% | 1.51% | 12.78% | 1,893 | 3 |
Source: ASX and Morningstar
Figure 37: USA Equity EFTs
| Name | Code | FUM ($M) | Qtr Flows ($M) | MER | Qtr Avg Spread | 3MTH Return | 12MTH Return | Historical YLD | QTR AVG Liquidity | Daily Vol-QTR AVG | STAR Rating |
|---|---|---|---|---|---|---|---|---|---|---|---|
| USA | |||||||||||
| Equities - Broad | |||||||||||
| iShares S&P Mid-Cap ETF | IJH | 118.71 | -1.15 | 0.07% | 0.27% | -5.29% | 6.36% | 1.23% | 15.00% | 2,663 | 3 |
| iShares S&P Small-Cap ETF | IJR | 93.84 | 7.16 | 0.07% | 0.71% | -4.94% | 7.07% | 1.09% | 6.07% | 1,946 | 3 |
| iShares Russell 2000 ETF (AU) | IRU | 66.01 | 3.06 | 0.20% | 0.33% | -3.44% | 8.86% | 1.10% | 4.62% | 532 | 2 |
| iShares S&P 500 ETF | IVV | 2,309.70 | 72.16 | 0.04% | 0.04% | -3.35% | 10.03% | 1.61% | 5.31% | 12,622 | 4 |
| BetaShares NASDAQ 100 ETF | NDQ | 187.82 | 38.85 | 0.48% | 0.11% | 3.61% | 20.16% | 0.49% | 16.51% | 75,013 | 4 |
| BetaShares FTSE RAFI US 1000 ETF | QUS | 30.68 | 0.03 | 0.40% | 0.18% | 1.87% | 13.33% | 2.23% | 11.73% | 3,930 | 3 |
| SPDR? S&P 500 ETF | SPY | 20.12 | -1.25 | 0.09% | 0.07% | -3.37% | 9.92% | 1.77% | 8.57% | 188 | 3 |
| Vanguard US Total Market Shares ETF | VTS | 1,064.75 | 45.21 | 0.04% | 0.08% | -3.36% | 9.73% | 1.60% | 4.21% | 8,991 | 4 |
| Equities - Strategy | |||||||||||
| BetaShares Geared US Eq- Ccy Hdg | GGUS | 9.64 | 0.00 | 0.80% | 0.13% | 8.47% | 37.39% | 0.72% | 26.58% | 6,231 | 2 |
| iShares S&P 500 AUD Hedged ETF | IHVV | 86.98 | -2.85 | 0.10% | 0.12% | 4.43% | 19.00% | 1.87% | 18.31% | 1,605 | 3 |
| UBS IQ MSCI USA Ethical ETF | UBU | 5.89 | 0.01 | 0.20% | 0.29% | 2.02% | 14.58% | 2.08% | 9.80% | 824 | 2 |
| BetaShares S&P 500 Yield Maximiser | UMAX | 91.27 | 3.53 | 0.79% | 0.17% | 1.30% | 11.60% | 4.64% | 7.11% | 12,170 | 3 |
| ETFS S&P 500 High Yield Low Volatil ETF | ZYUS | 52.15 | 6.00 | 0.35% | 0.19% | -0.52% | 5.16% | 6.37% | 9.23% | 12,701 | 3 |
| BetaShares US Eqs Strong Bear H-Ccy Hdg | BBUS | 72.34 | 19.26 | 1.38% | 0.18% | -9.62% | -34.39% | 0.00% | 30.44% | 99,156 | 2 |
Source: ASX and Morningstar
Figure 38: Asian Equity EFTs
| Name | Code | FUM ($M) | Qtr Flows ($M) | MER | Qtr Avg Spread | 3MTH Return | 12MTH Return | Historical YLD | QTR AVG Liquidity | Daily Vol-QTR AVG | STAR Rating |
|---|---|---|---|---|---|---|---|---|---|---|---|
| ASIA | |||||||||||
| Equities - Broad | |||||||||||
| Market Vectors ChinaAMC A-Share ETF(Syn) | CETF | 5.09 | 2.04 | 0.72% | 0.44% | 5.21% | 16.59% | 0.88% | 24.98% | 655 | 2 |
| BetaShares WisdomTree Japan ETF-Ccy Hdg | HJPN | 47.48 | 6.50 | 0.58% | 0.17% | 5.39% | 31.32% | 2.28% | 21.33% | 23,932 | 2 |
| iShares Asia 50 ETF (AU) | IAA | 322.28 | 24.20 | 0.50% | 0.35% | 4.25% | 21.94% | 1.48% | 5.66% | 7,751 | 3 |
| iShares MSCI Hong Kong ETF (AU) | IHK | 11.84 | 0.28 | 0.48% | 0.70% | 2.64% | 12.84% | 2.16% | 9.28% | 1,219 | 2 |
| iShares MSCI Japan ETF (AU) | IJP | 180.11 | 5.22 | 0.48% | 0.13% | 1.57% | 10.80% | 1.47% | 8.42% | 7,157 | 3 |
| iShares MSCI South Korea Capped ETF (AU) | IKO | 44.46 | 3.24 | 0.64% | 0.34% | -0.80% | 17.69% | 0.83% | 6.34% | 1,040 | 2 |
| iShares MSCI Singapore ETF | ISG | 8.25 | 0.84 | 0.48% | 0.47% | 0.65% | 14.70% | 3.31% | 18.96% | 1,883 | 2 |
| iShares MSCI Taiwan ETF | ITW | 60.28 | -6.20 | 0.64% | 0.93% | -1.83% | 15.42% | 1.72% | 9.07% | 4,127 | 2 |
| iShares China Large-Cap ETF (AU) | IZZ | 79.50 | 1.18 | 0.74% | 0.46% | 7.34% | 16.21% | 1.75% | 7.64% | 3,758 | 2 |
| Vanguard FTSE Asia ex Japan Shrs Idx ETF | VAE | 35.53 | 7.08 | 0.40% | 0.29% | 3.28% | 17.54% | 2.85% | 25.65% | 4,399 | 2 |
| Equities - Strategy | |||||||||||
| UBS IQ MSCI Japan Ethical ETF | UBJ | 3.24 | 0.00 | 0.40% | 0.26% | 1.49% | 11.44% | 1.50% | 2.97% | 149 | 2 |
| UBS IQ MSCI Asia APEX 50 Ethical ETF | UBP | 4.11 | 0.00 | 0.45% | 0.30% | 6.25% | 25.63% | 0.35% | 12.66% | 746 | 2 |
Source: ASX and Morningstar
Figure 39: European Equity EFTs
| Name | Code | FUM ($M) | Qtr Flows ($M) | MER | Qtr Avg Spread | 3MTH Return | 12MTH Return | Historical YLD | QTR AVG Liquidity | Daily Vol-QTR AVG | STAR Rating |
|---|---|---|---|---|---|---|---|---|---|---|---|
| EUROPE | |||||||||||
| Equities - Broad | |||||||||||
| ETFS EURO STOXX 50? ETF | ESTX | 24.77 | 12.79 | 0.35% | 0.21% | 5.99% | 26.00% | 1.08% | 25.91% | 2,650 | 2 |
| BetaShares WisdomTree Europe ETF-Ccy Hdg | HEUR | 48.29 | 3.73 | 0.58% | 0.15% | 3.92% | 23.90% | 1.67% | 21.14% | 26,820 | 2 |
| iShares Europe ETF (AU) | IEU | 699.76 | 75.56 | 0.60% | 0.13% | 3.99% | 18.98% | 2.09% | 8.11% | 30,483 | 3 |
| Vanguard FTSE Europe Shares ETF | VEQ | 115.65 | 29.71 | 0.35% | 0.18% | 3.71% | 19.41% | 2.24% | 14.95% | 9,948 | 3 |
| Equities - Strategy | |||||||||||
| UBS IQ MSCI Europe Ethical ETF | UBE | 8.89 | 1.06 | 0.40% | 0.36% | 4.25% | 19.69% | 2.48% | 9.89% | 1,319 | 2 |
Source: ASX and Morningstar
Figure 40: Emerging Markets Equity EFTs
| Name | Code | FUM ($M) | Qtr Flows ($M) | MER | Qtr Avg Spread | 3MTH Return | 12MTH Return | Historical YLD | QTR AVG Liquidity | Daily Vol-QTR AVG | STAR Rating |
|---|---|---|---|---|---|---|---|---|---|---|---|
| EMERGING MARKETS | |||||||||||
| Equities - Broad | |||||||||||
| iShares MSCI BRIC ETF (AU) | IBK | 32.79 | 3.14 | 0.72% | 0.64% | 11.06% | 24.02% | 1.12% | 7.67% | 1,557 | 2 |
| iShares MSCI Emerging Markets ETF (AU) | IEM | 554.64 | 51.72 | 0.72% | 0.22% | 5.27% | 18.66% | 1.16% | 5.58% | 17,671 | 3 |
| Vanguard FTSE Emerging Markets Shrs ETF | VGE | 140.49 | 25.25 | 0.48% | 0.27% | 5.27% | 14.93% | 1.71% | 12.08% | 8,645 | 3 |
| SPDR? S&P Emerging Markets ETF | WEMG | 19.92 | 3.93 | 0.65% | 0.27% | 5.55% | 18.07% | 1.39% | 7.87% | 2,422 | 2 |

