Australian CleanTech Index - FY 2013
The ACT Australian CleanTech Index provides the definitive measure of the performance of Australian listed cleantech stocks.
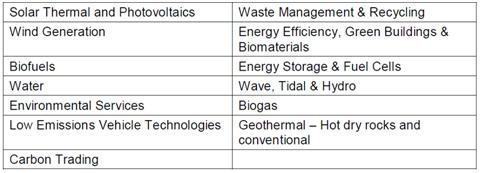
The cleantech industry is split into a number of sub-sectors as detailed in the table below. Each of the sub-sectors contains companies that have both environmental and economic benefits.
The cleantech sector is fundamentally different to Socially Responsible Investments (SRI) or Environmental, Social and Governance (ESG) performance. SRI and ESG look at incremental improvements in company performance and can be seen as ‘operational hygiene’ measures that find the best in class. Cleantech focuses on companies whose output positively enhances the communities and ecologies in which they reside. It is about doing ‘more good’ rather than ‘less bad’.
With 70 companies falling under the coverage of the Index and with a combined market capitalisation of over $8 billion, the ACT Australian CleanTech Index presents for the first time a picture of the Australian cleantech industry’s growth in a single measure.
The Index is weighted by market capitalisation and is benchmarked against both the S&P/ASX200 and the S&P/ASX Small Ordinaries. The rules for the formulation and management of the Index have been developed with reference to global best practice.
ACT Australian CleanTech Index Performance 2012-13
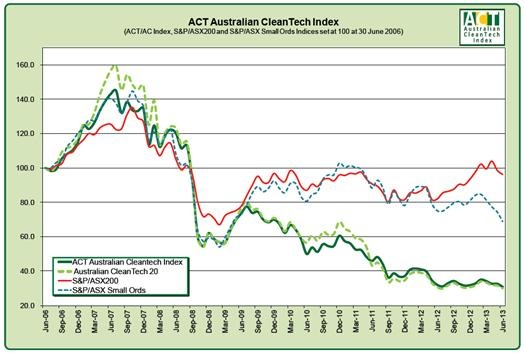
ACT Australian CleanTech Index underperformed against the S&P ASX200 but outperformed the S&P Small Ordinaries for the month of June 2013, the fourth quarter of 2013 and over the full fiscal year.
The ACT Australian CleanTech Index fell from 32.7 to 31.0 over the month of June recording a 5.4 per cent loss. This compared to the S&P ASX200 loss of 2.5 per cent and the S&P ASX Small Ordinaries Index loss of 7.4 per cent.
Over the fourth quarter of the 2013 fiscal year, the ACT Australian CleanTech Index recorded a loss of 9.6 per cent, compared with the 3.3 per cent loss by the S&P ASX200 and the 15.3 per cent loss by the S&P ASX Small Ordinaries.
Over the second half of the 2013 fiscal year, the ACT Australian CleanTech Index recorded a loss of 3.1 per cent compared with the 2.8 per cent gain by the S&P ASX200 and the 15.0 per cent loss by the S&P ASX Small Ordinaries.
Finally, over the 2013 fiscal year, the ACT Australian CleanTech Index recorded a loss of 3.5 per cent, lagging well behind the S&P ASX200’s gain of 17.3 per cent but ahead of the S&P ASX Small Ordinaries’ loss of 8.3 per cent.

The market capitalisation of the 70 stocks in the ACT Australian CleanTech Index after its rebalancing is $8.6 billion, well off its peak of $16.3 billion in July 2007.
The largest falls in market capitalisation over the month were recorded by Dyesol, Silex Systems, Transpacific Industries, Sims Metal Management and Orocobre with the greatest gains recorded by Reece Australia Holdings, Nanosonics and Energy Developments.
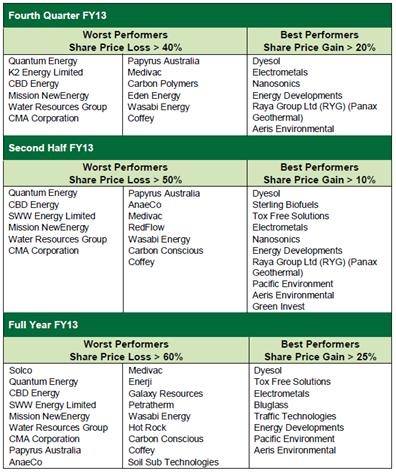
The best and worst performers in terms of share price performance over the previous year are shown in the table below.
Component sub-indices
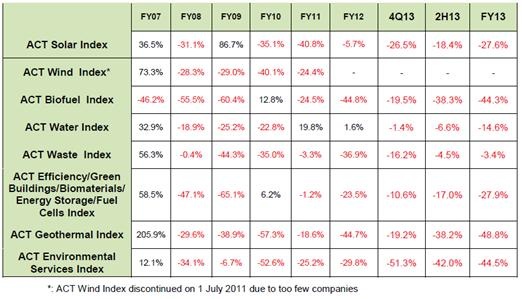
To provide an analysis of the ACT Australian CleanTech Index, seven sub-indices have been developed. The performance of each of these sub-indices over the last five financial years is shown in the table below.
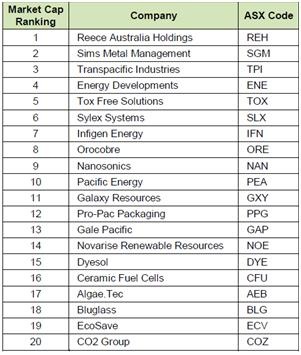
Component companies on 30 June 2013
The largest 20 index constituents by market capitalisation on 30 June 2013 are provided in the table below. New entrants to the Cleantech20 in this rebalance are Dyesol, EcoSave and CO2 Group. These have replaced Wasabi Energy, Carnegie Wave Energy and Coffey.
The ACT Australian Cleantech Index is updated each month and published on the Australian CleanTech website.


